Your spreadsheet got you this far. Greenline takes it from here.
You built a spreadsheet because nothing else worked. Now something does.
Check your portfolio from anywhere
Spreadsheets are great, but they're only really useful when you're at your desk.
Greenline goes wherever you do. Get the app →
Your data, your way
Bring your spreadsheet with you
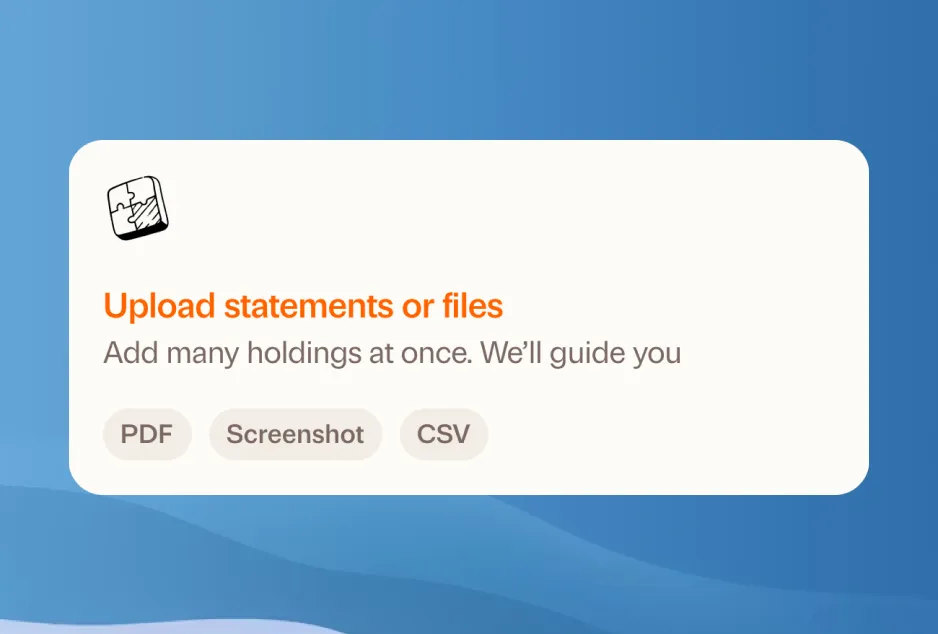
You don't have to retype years of history. Greenline reads CSVs, PDFs, even screenshots of your statements.
The security of a spreadsheet, built in
No bank logins, no account linking, no third-party access to your money. Your data gets in on your terms.
Bring your spreadsheet with you
You don't have to retype years of history. Greenline reads CSVs, PDFs, even screenshots of your statements. However your data exists today, there's a way to bring it in.
The security of a spreadsheet, built in
No bank logins, no account linking, no third-party access to your money. Your data gets in on your terms, the same way it did with your spreadsheet.
You still enter your own data. That's on purpose.
The best thing about your spreadsheet was that it kept you close to your money. Greenline keeps that. Every time you update your portfolio, you're building a habit most investors never develop: actually knowing what you own. You can upload a PDF, drop in a CSV, snap a screenshot, or type it in manually. Your bank login never leaves your hands, your fraud protection stays intact, and you stay in control.
No more spreadsheet headaches
We used spreadsheets too. We know the routine: maintaining formulas nobody else understands, checking prices at your desk because it only works on your laptop, knowing your partner will never open the file. It works until it doesn't.
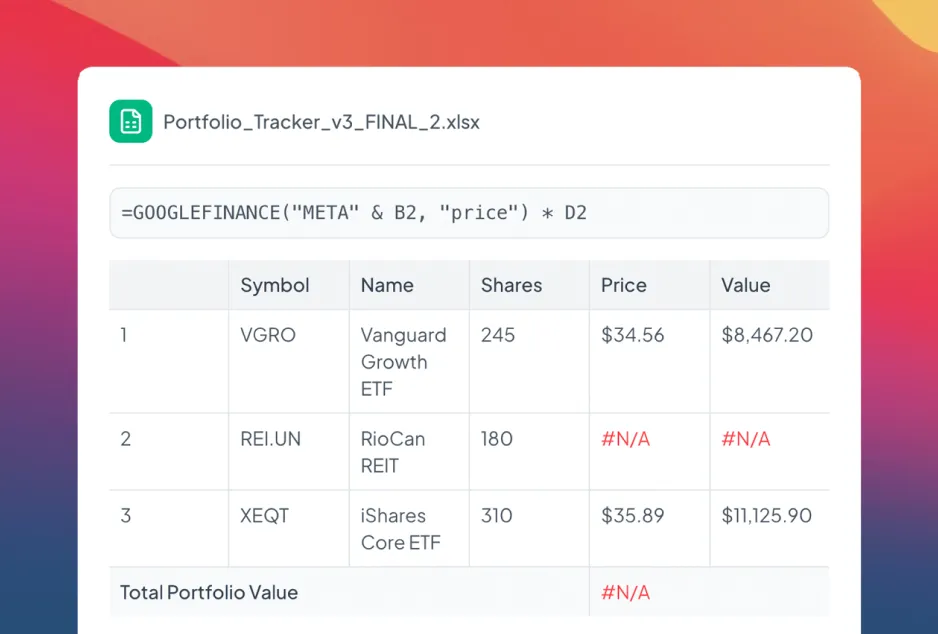
Have you ever...
Gotten #N/A errors on stock prices? (Happens more than it should)
Greenline's pricing data updates automatically. No more broken feeds or stale prices.
Added a column and broken all your formulas?
Greenline handles the math so you can add holdings and accounts without worrying about what else might break.
Had a stock split make everything look wrong until you fixed it by hand?
Greenline detects splits automatically. One click to confirm and your history is corrected.
I would've built my own Excel spreadsheet, but I never did because it was too hard. Greenline let me upload a few statements and have it all there.
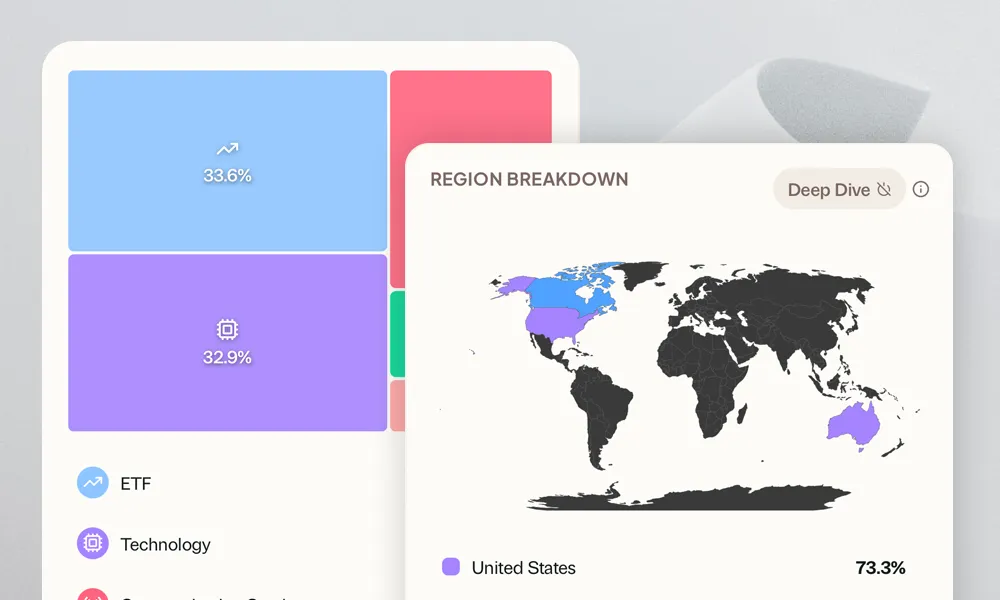
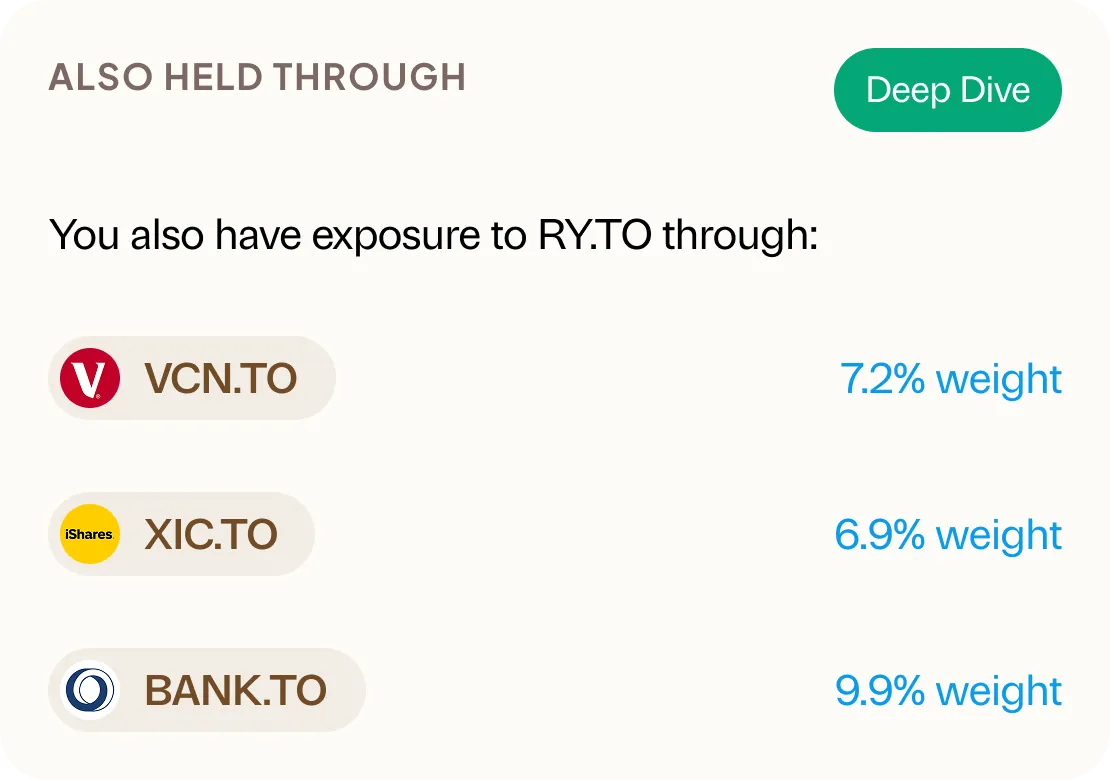
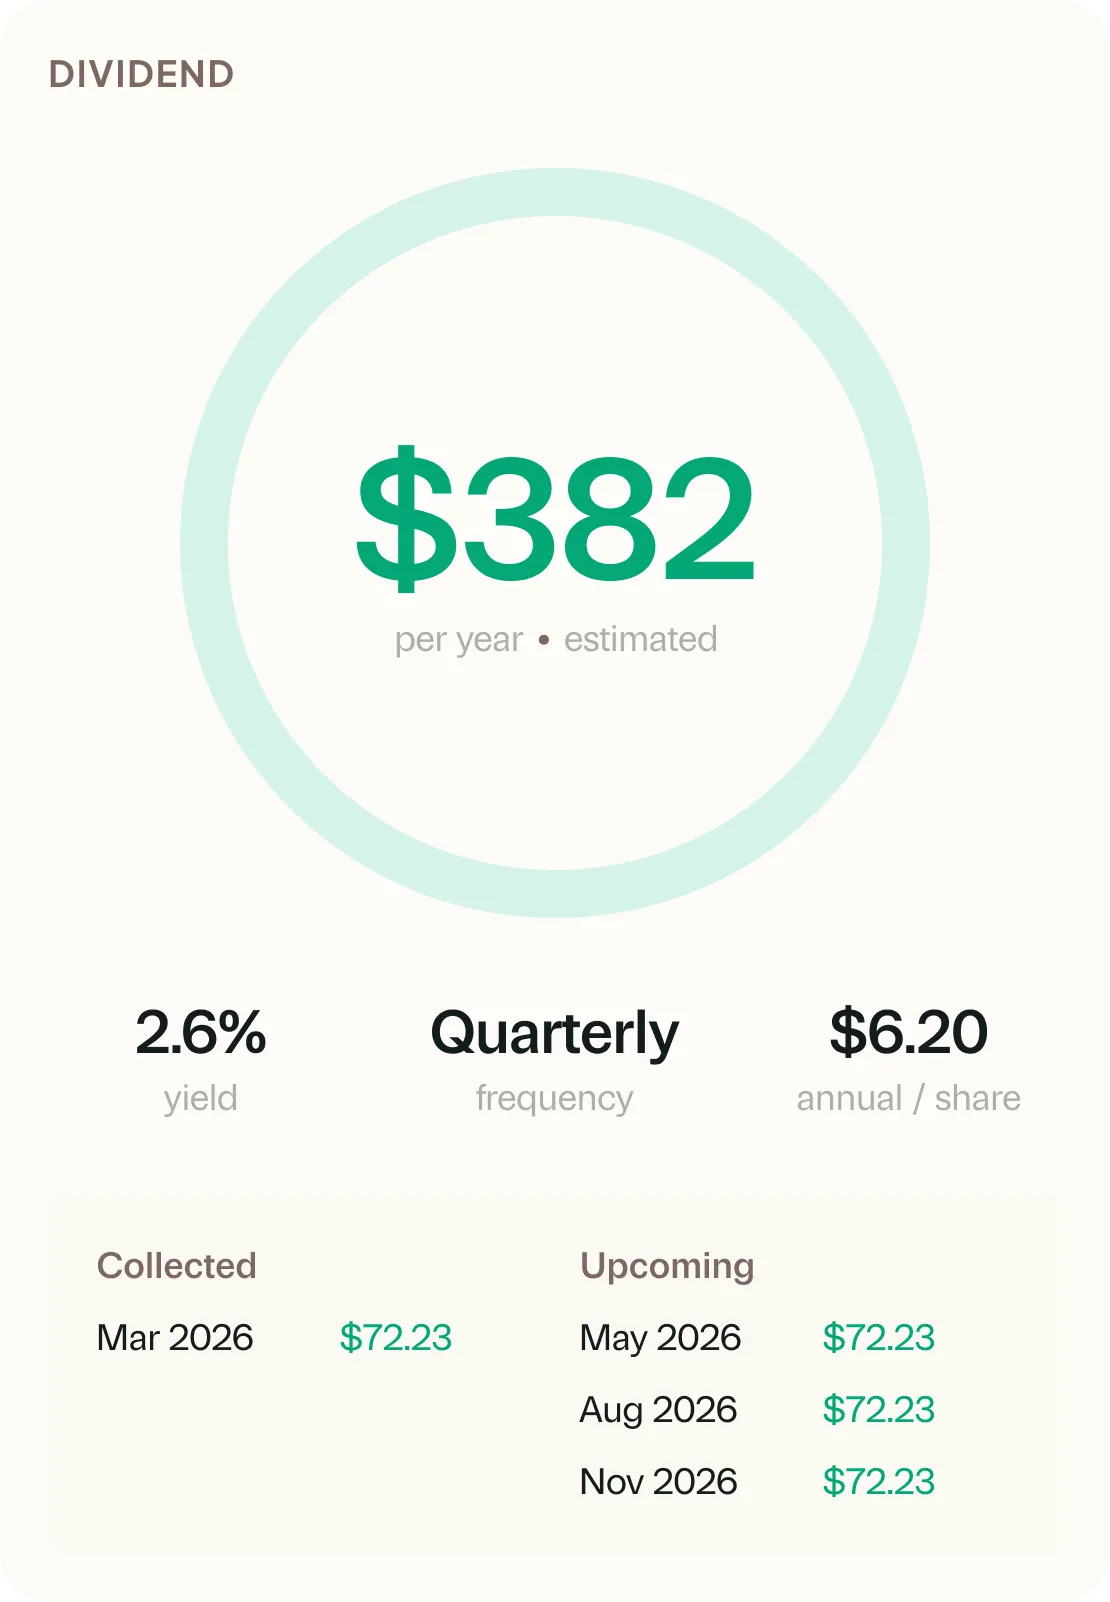
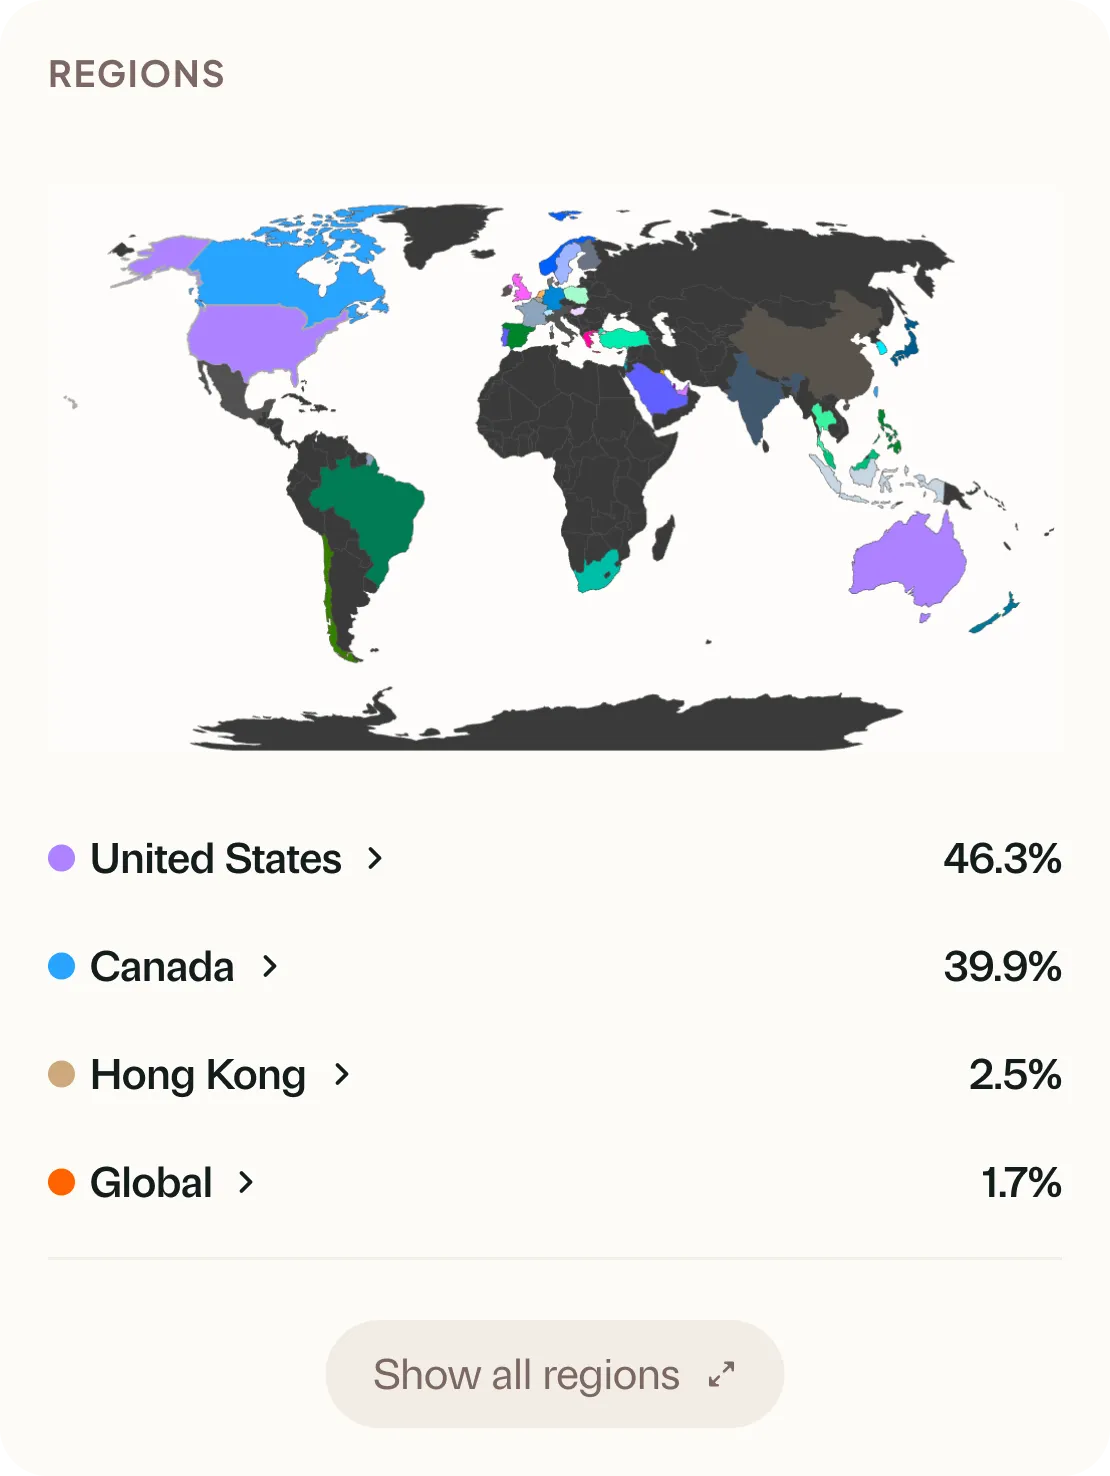
See what your spreadsheet never showed you
A spreadsheet only shows you what you've already thought to build a formula for. Greenline surfaces the rest: what you're really paying in fees, when dividends are coming, how your allocation has drifted, and where your risk is concentrated.

Guidance that works for you, not a bank
Your spreadsheet has no opinions. Your bank's app has opinions that serve the bank. Greenline gives you suggestions and insights focused on helping you make better decisions, with nothing to sell you.
Built by investors, for investors
We're DIY investors who spent years helping friends and family make sense of their portfolios. Spreadsheets, screen shares, "what does this fee mean?" conversations over coffee.
Eventually we stopped explaining and started building. Greenline shows you exactly what you own and what it costs. No trading, no robo-advice, no gimmicks.
Always improving
We release updates every month, shaped by what users actually ask for. Here's what's on the way.
Got an idea? Tell us. We're listening.
Works with any brokerage. Import via CSV, PDF, or screenshot.
See what your spreadsheet has been missing.
Import your spreadsheet and you'll be set up in minutes.
Start now, it's freeFree during Beta. Early Members will be offered better rates than new users when we launch paid plans.