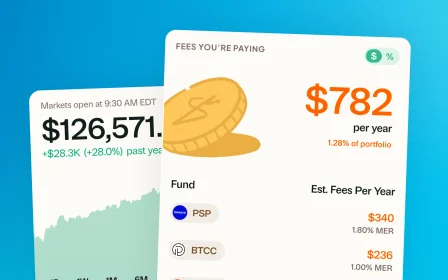
Your full track record
Your portfolio's value since day one, your best and worst days, and how every year actually went.
See your full portfolio, free
The same balance, two stories
A brokerage balance blends the money you put in with the money your investments earned. Greenline pulls those two apart.
What your brokerage shows
One number. It went up this year. Was that the market working, or just your deposits landing?
What Greenline shows
You deposited $40,000
Your investments earned $8,200
Illustrative numbers.
My brokerage only shows me the last month or three months. Greenline shows me more about my portfolio than my actual brokerage does.
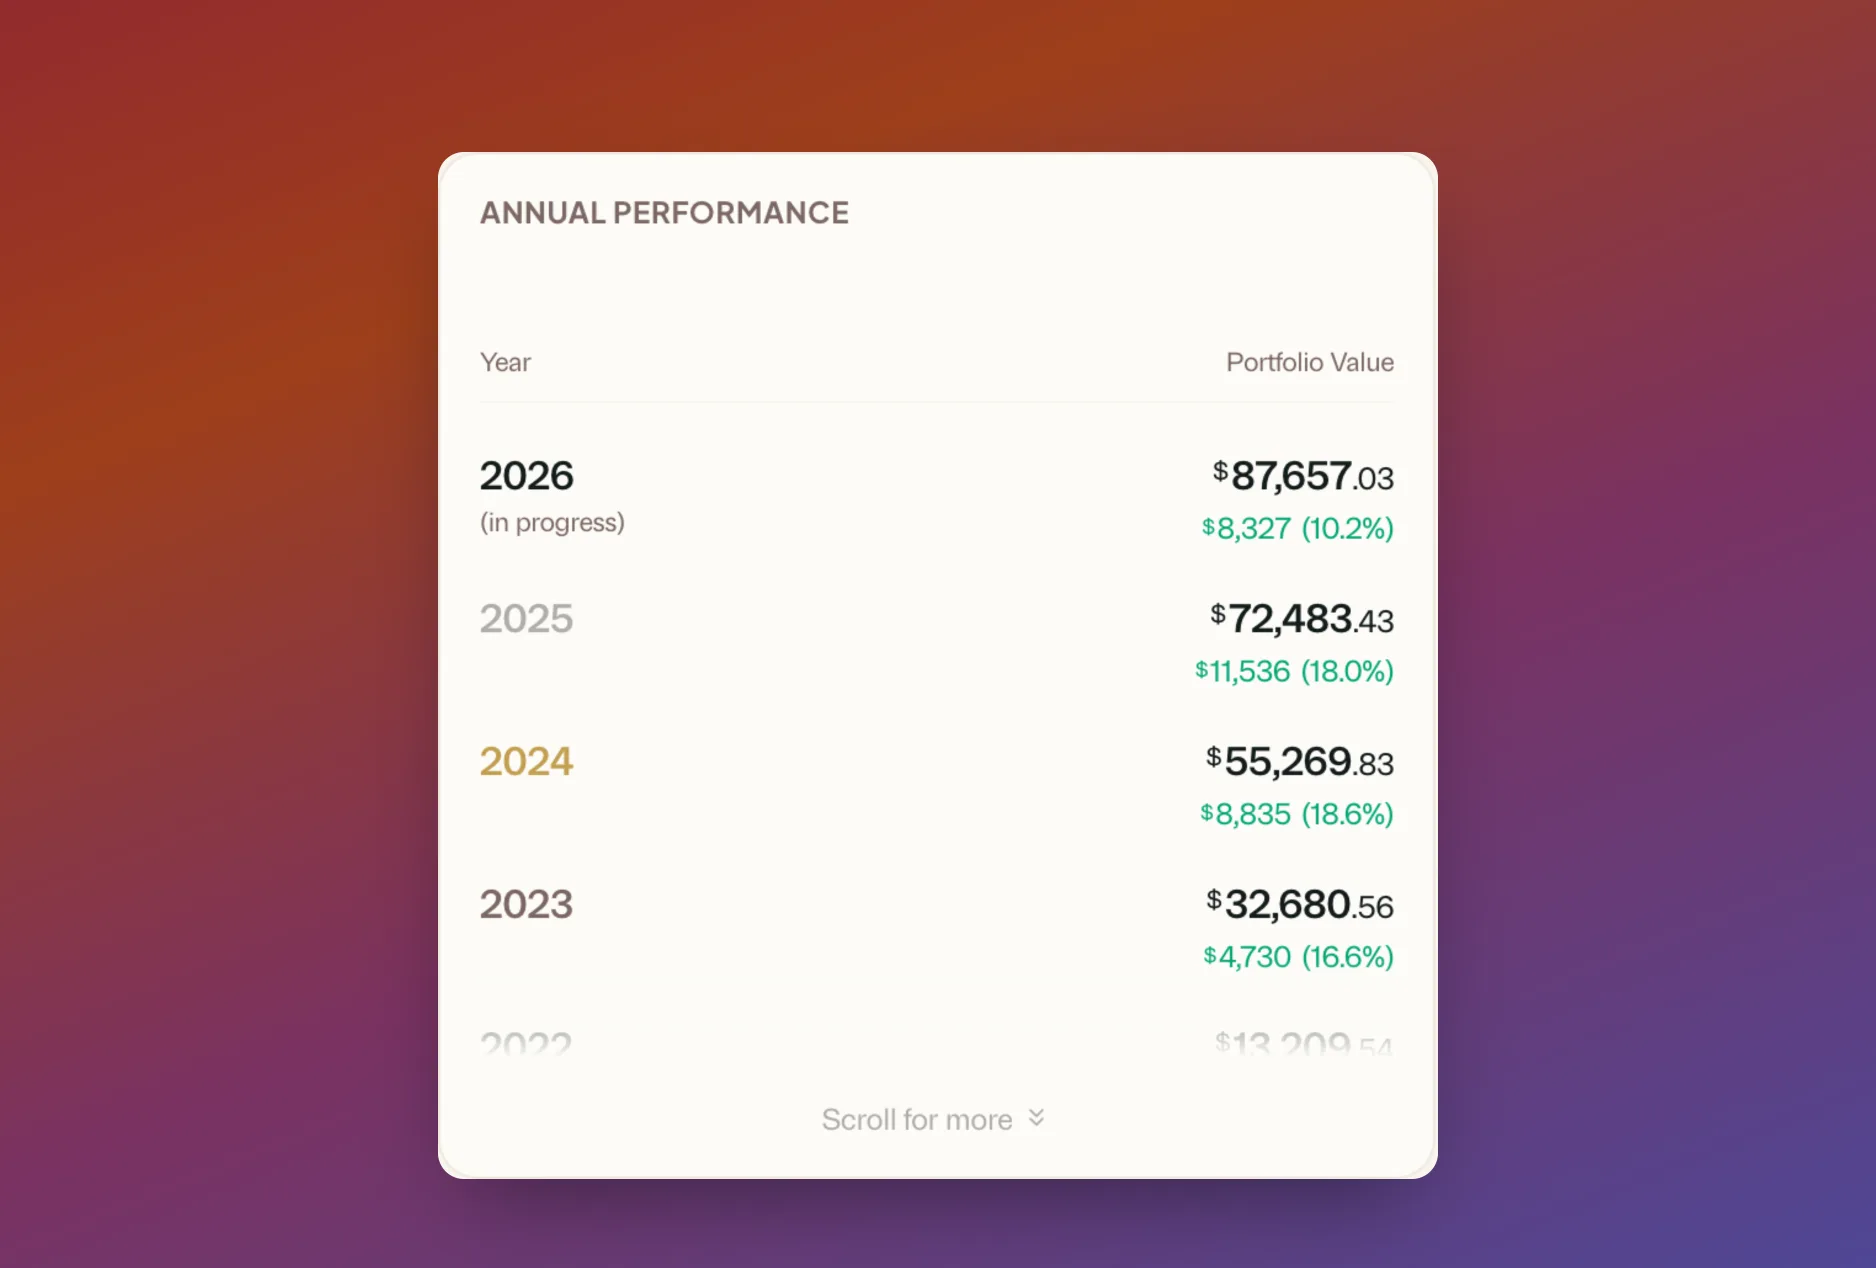
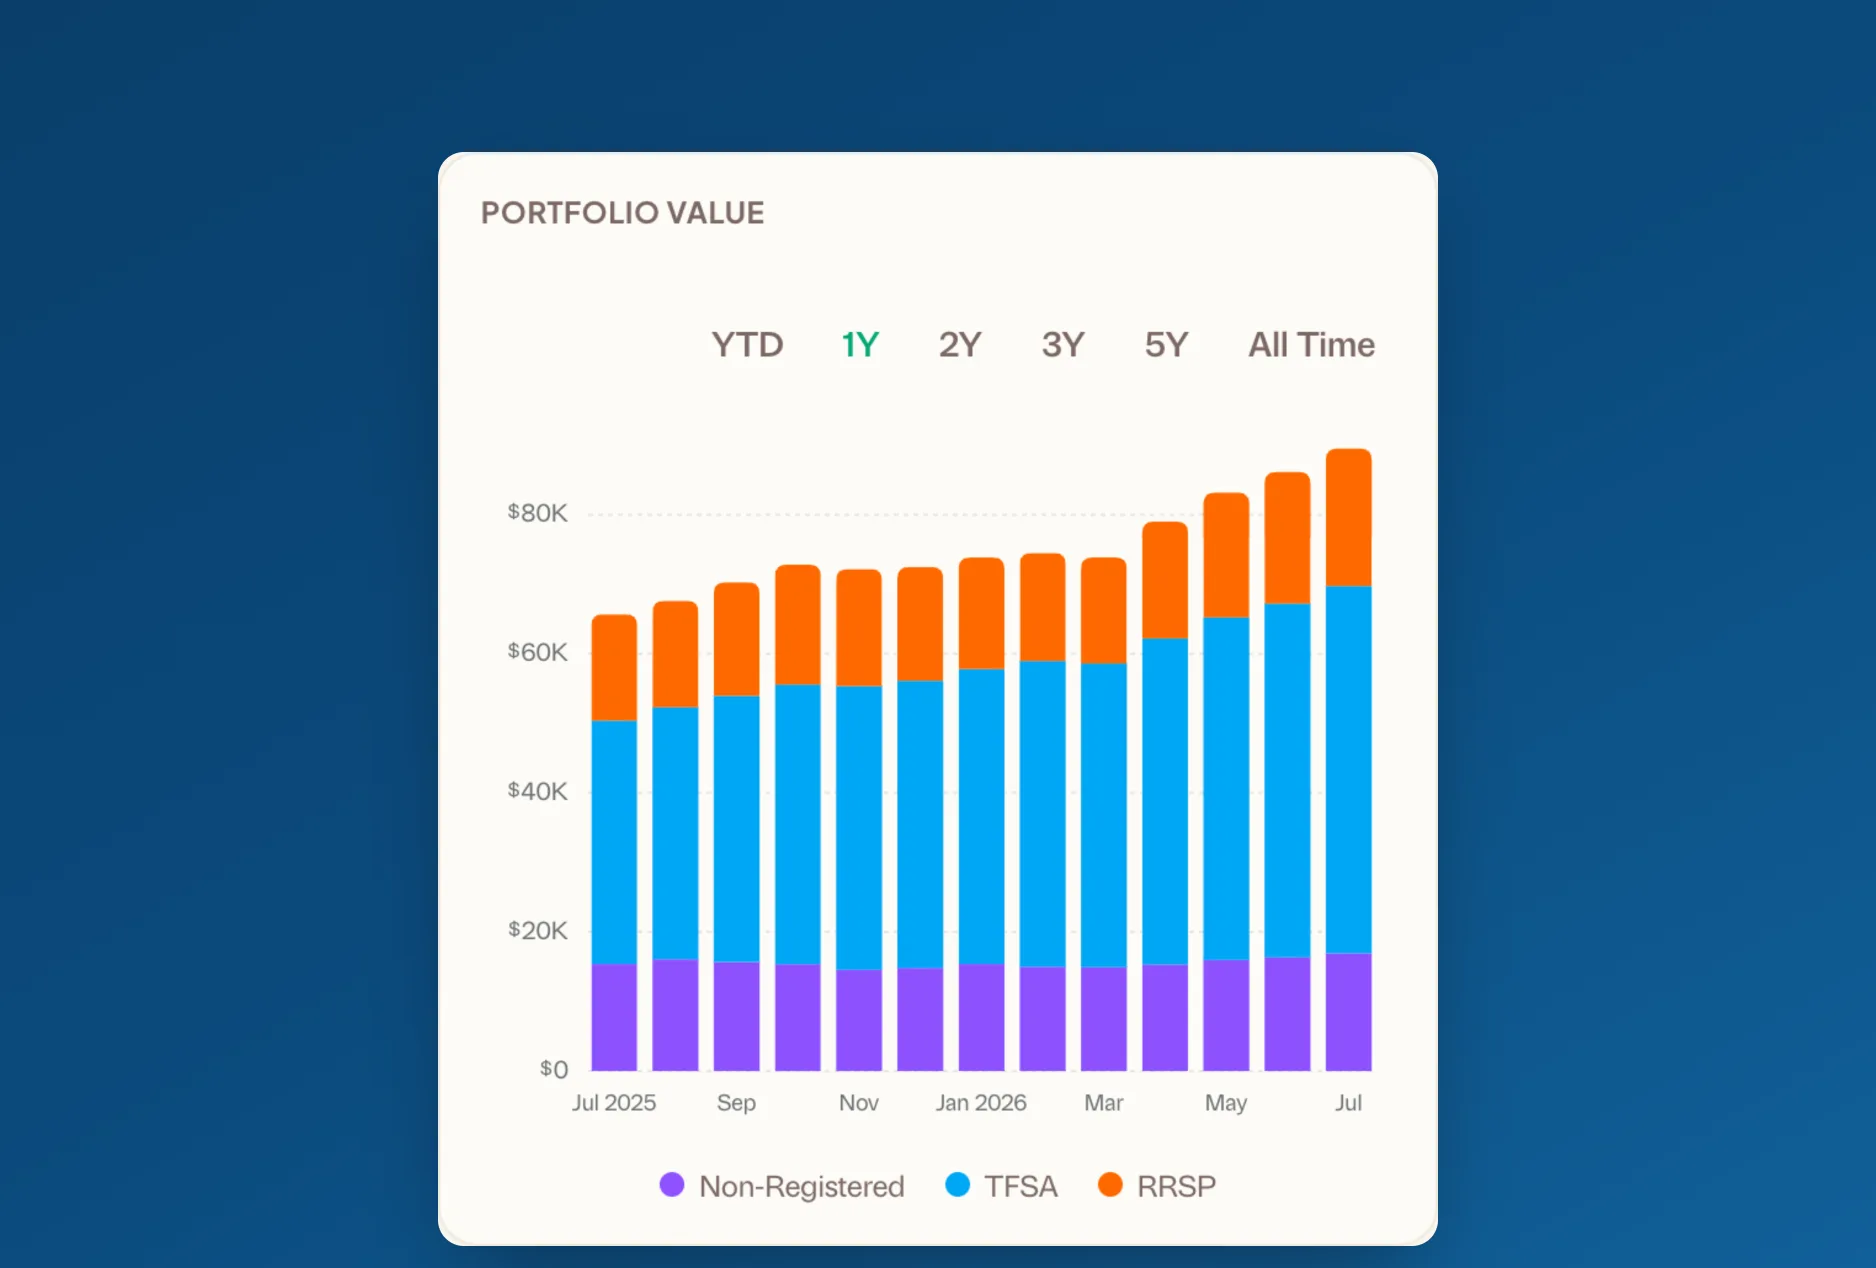
Year by year, quarter by quarter
Zoom out and see the shape of your investing life, not just this week's noise.
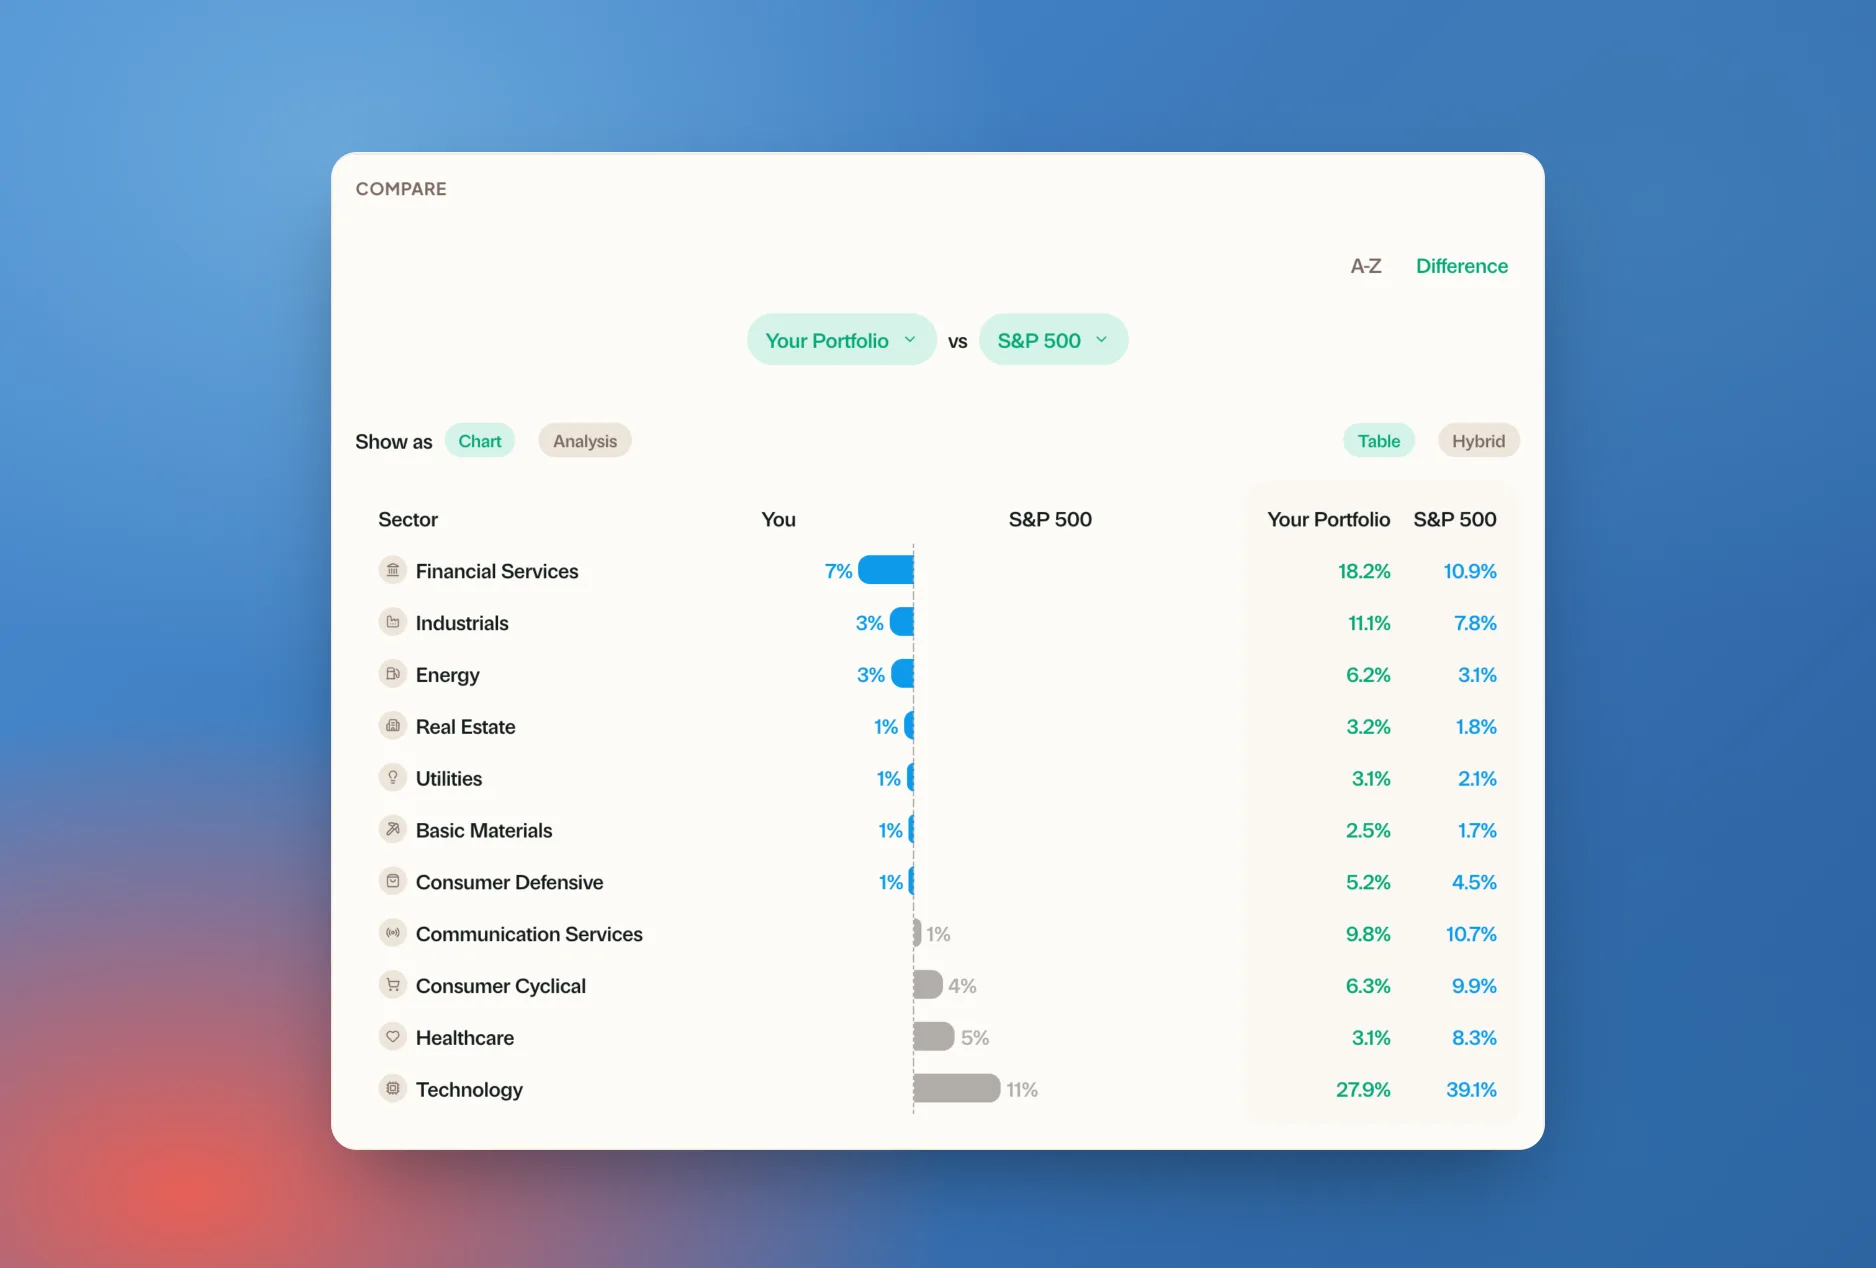
Next to the S&P 500
The honest question behind every portfolio: would the index have done better? Put yours beside it and find out.
Side by side
Your portfolio and the S&P 500 on one chart.
Similarity gauge
How much of the market's movement yours really follows.
The moments worth remembering
Investing is long. Greenline keeps the highlights, a whole reel of them.
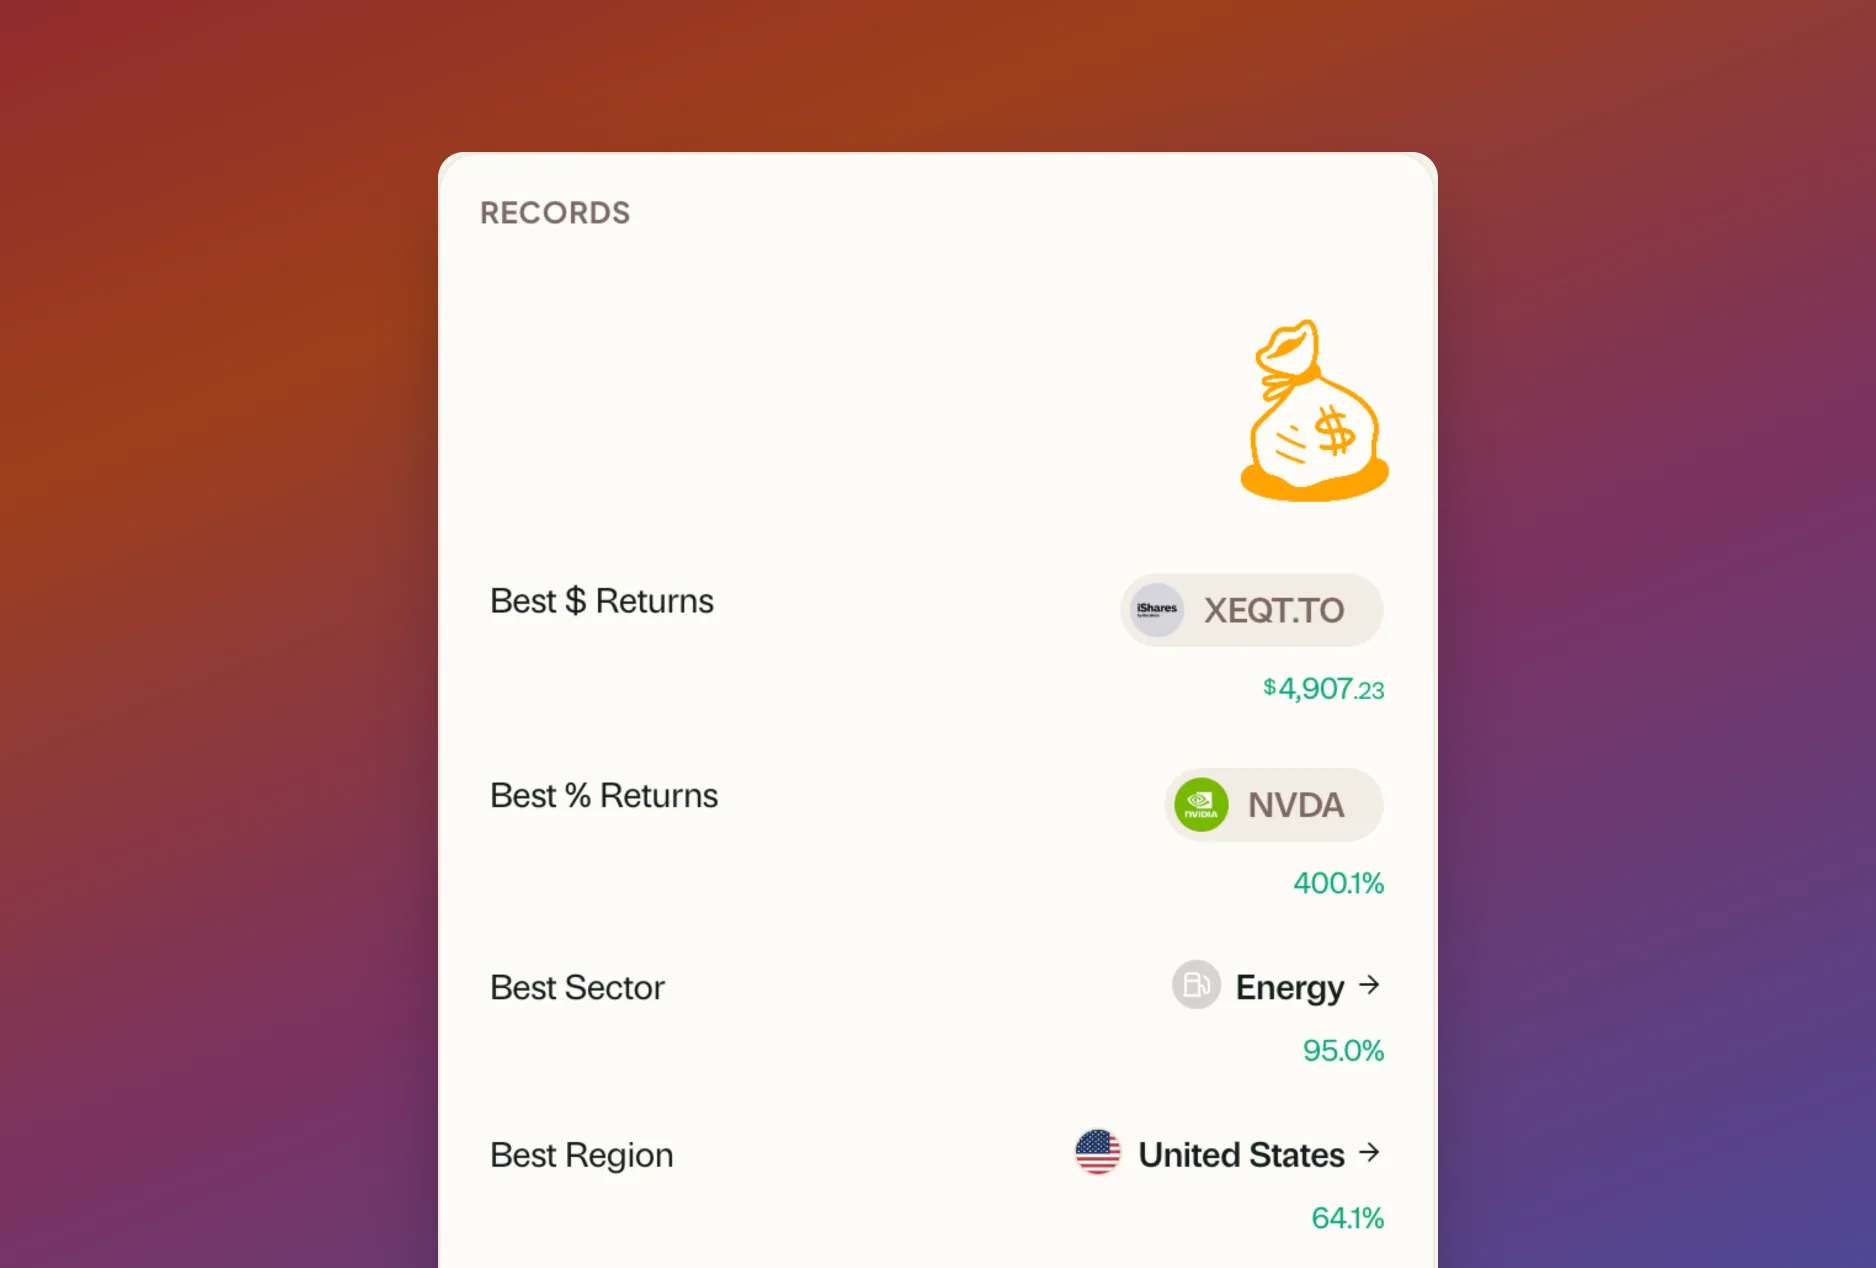
Records
Your best holding, sector, and region, by the numbers.
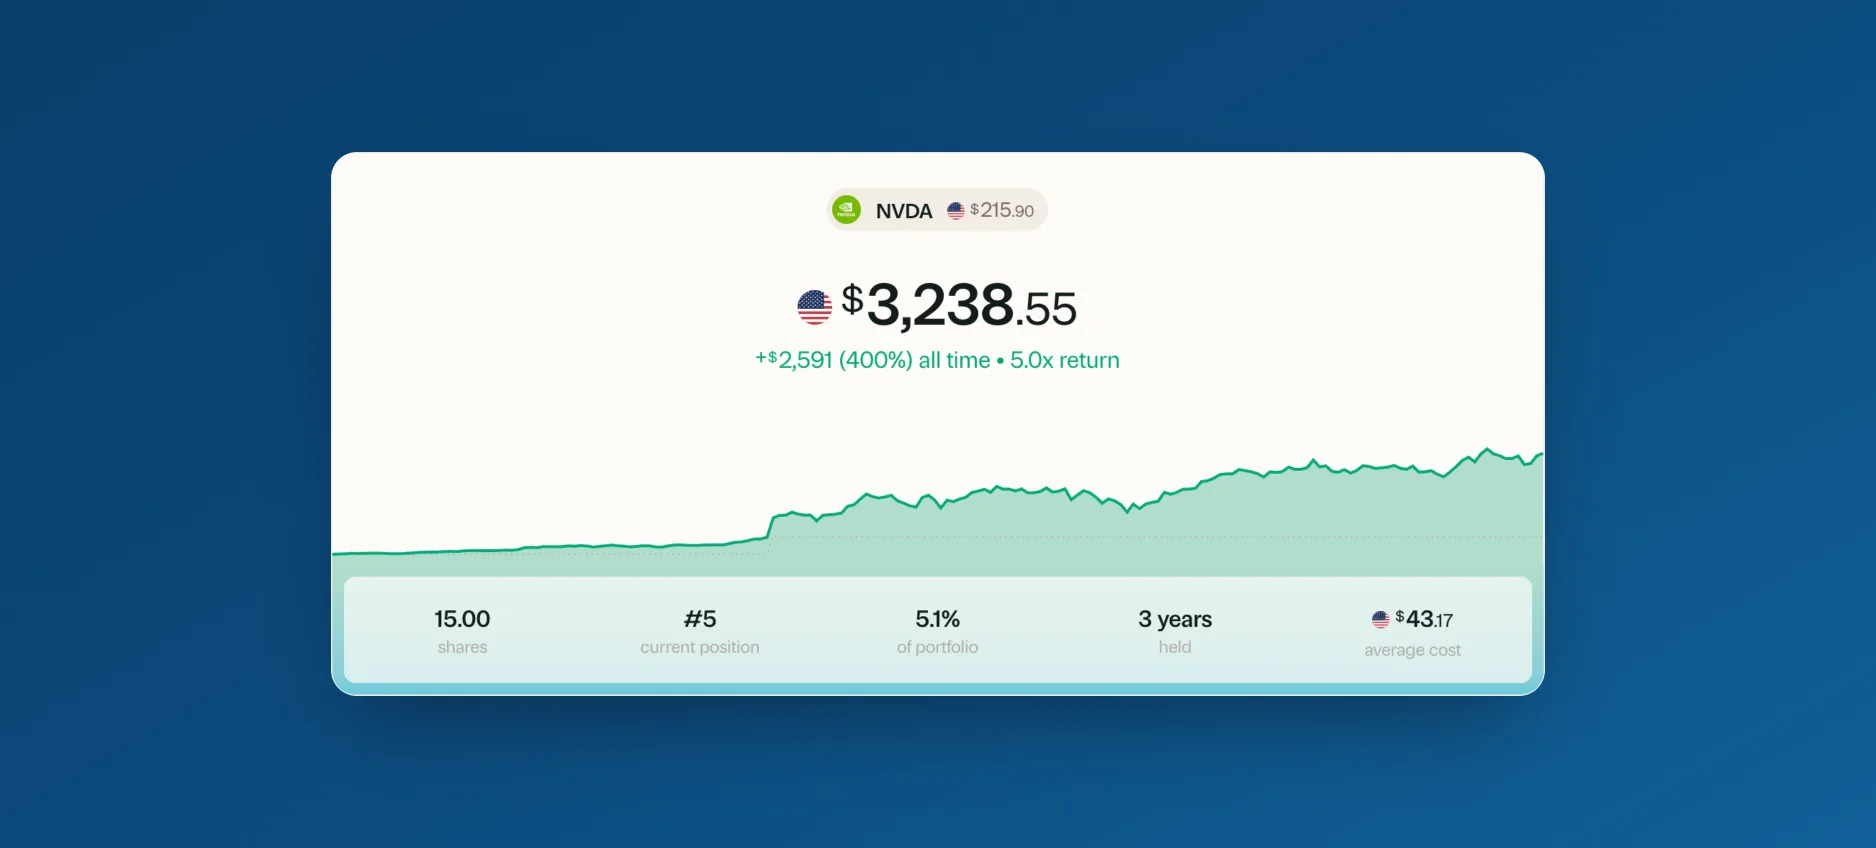
Position milestones
Each holding's peak, its share of your portfolio, and years held.
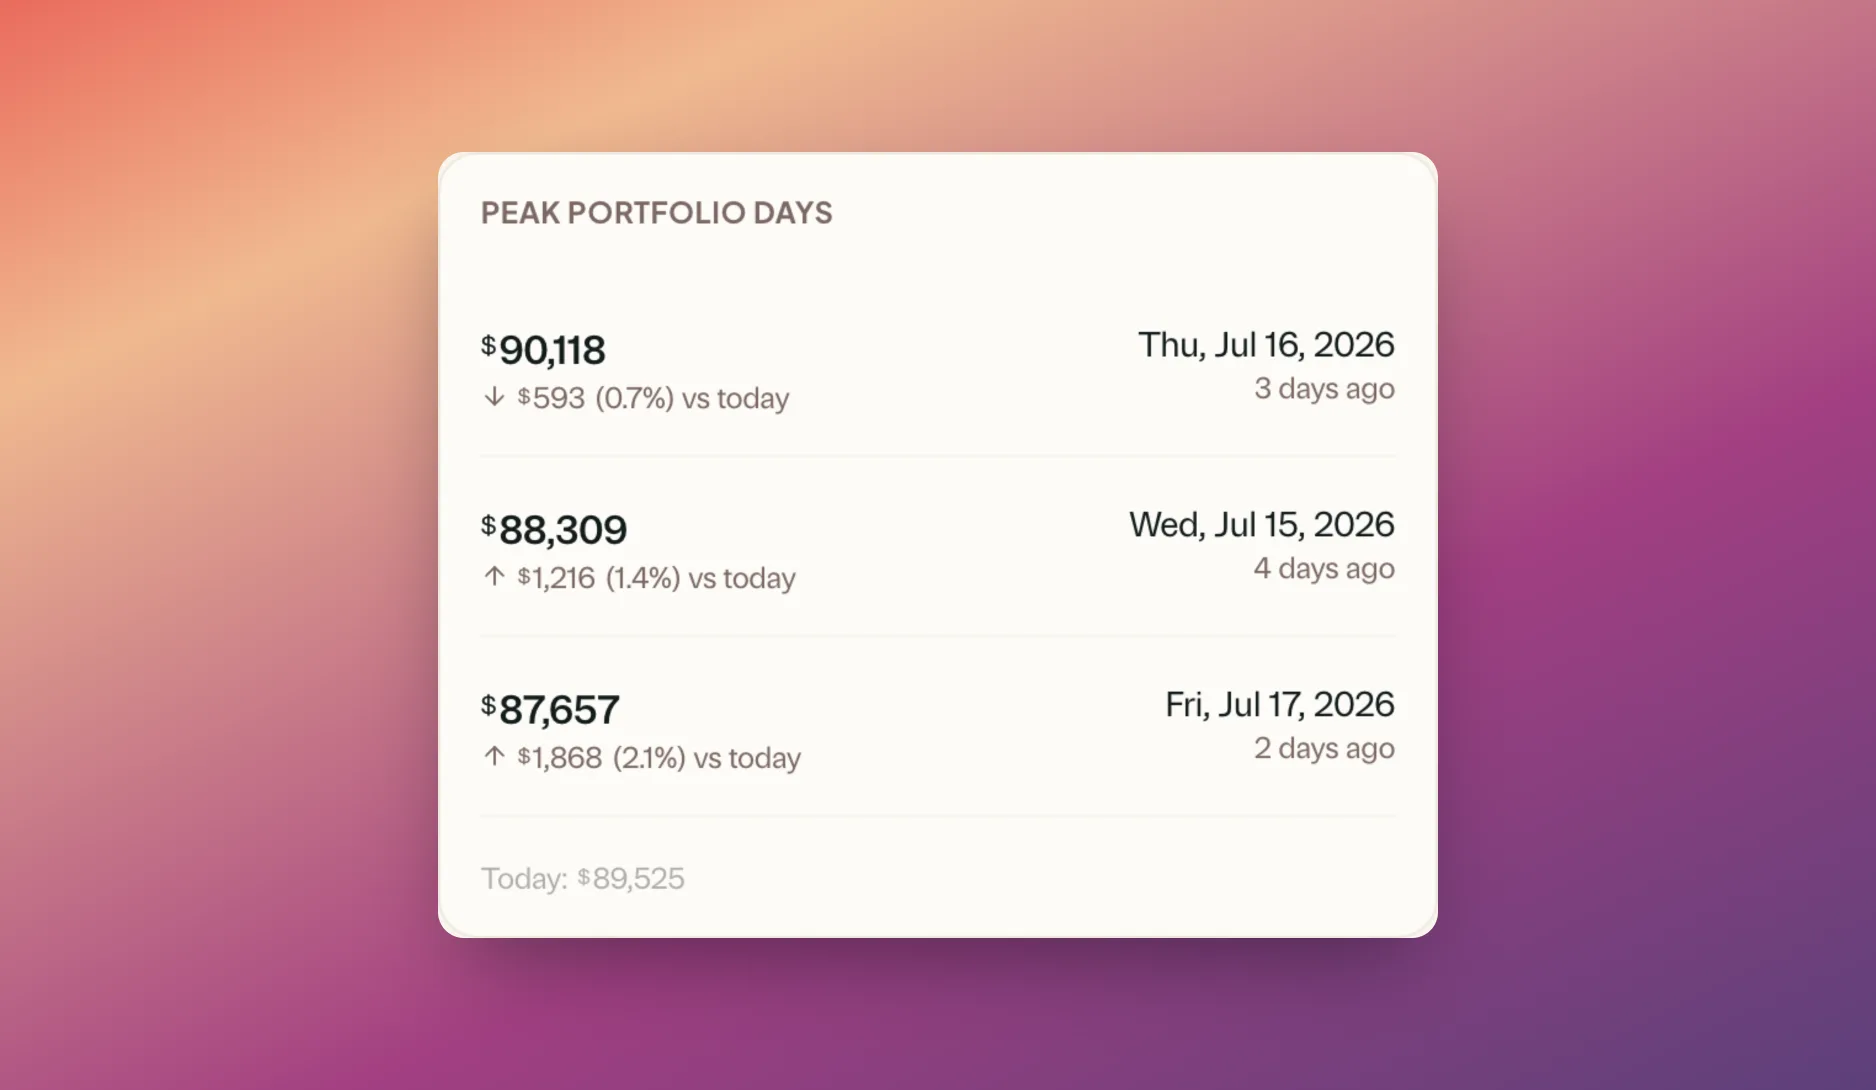
Peak days
The days your portfolio outdid itself.
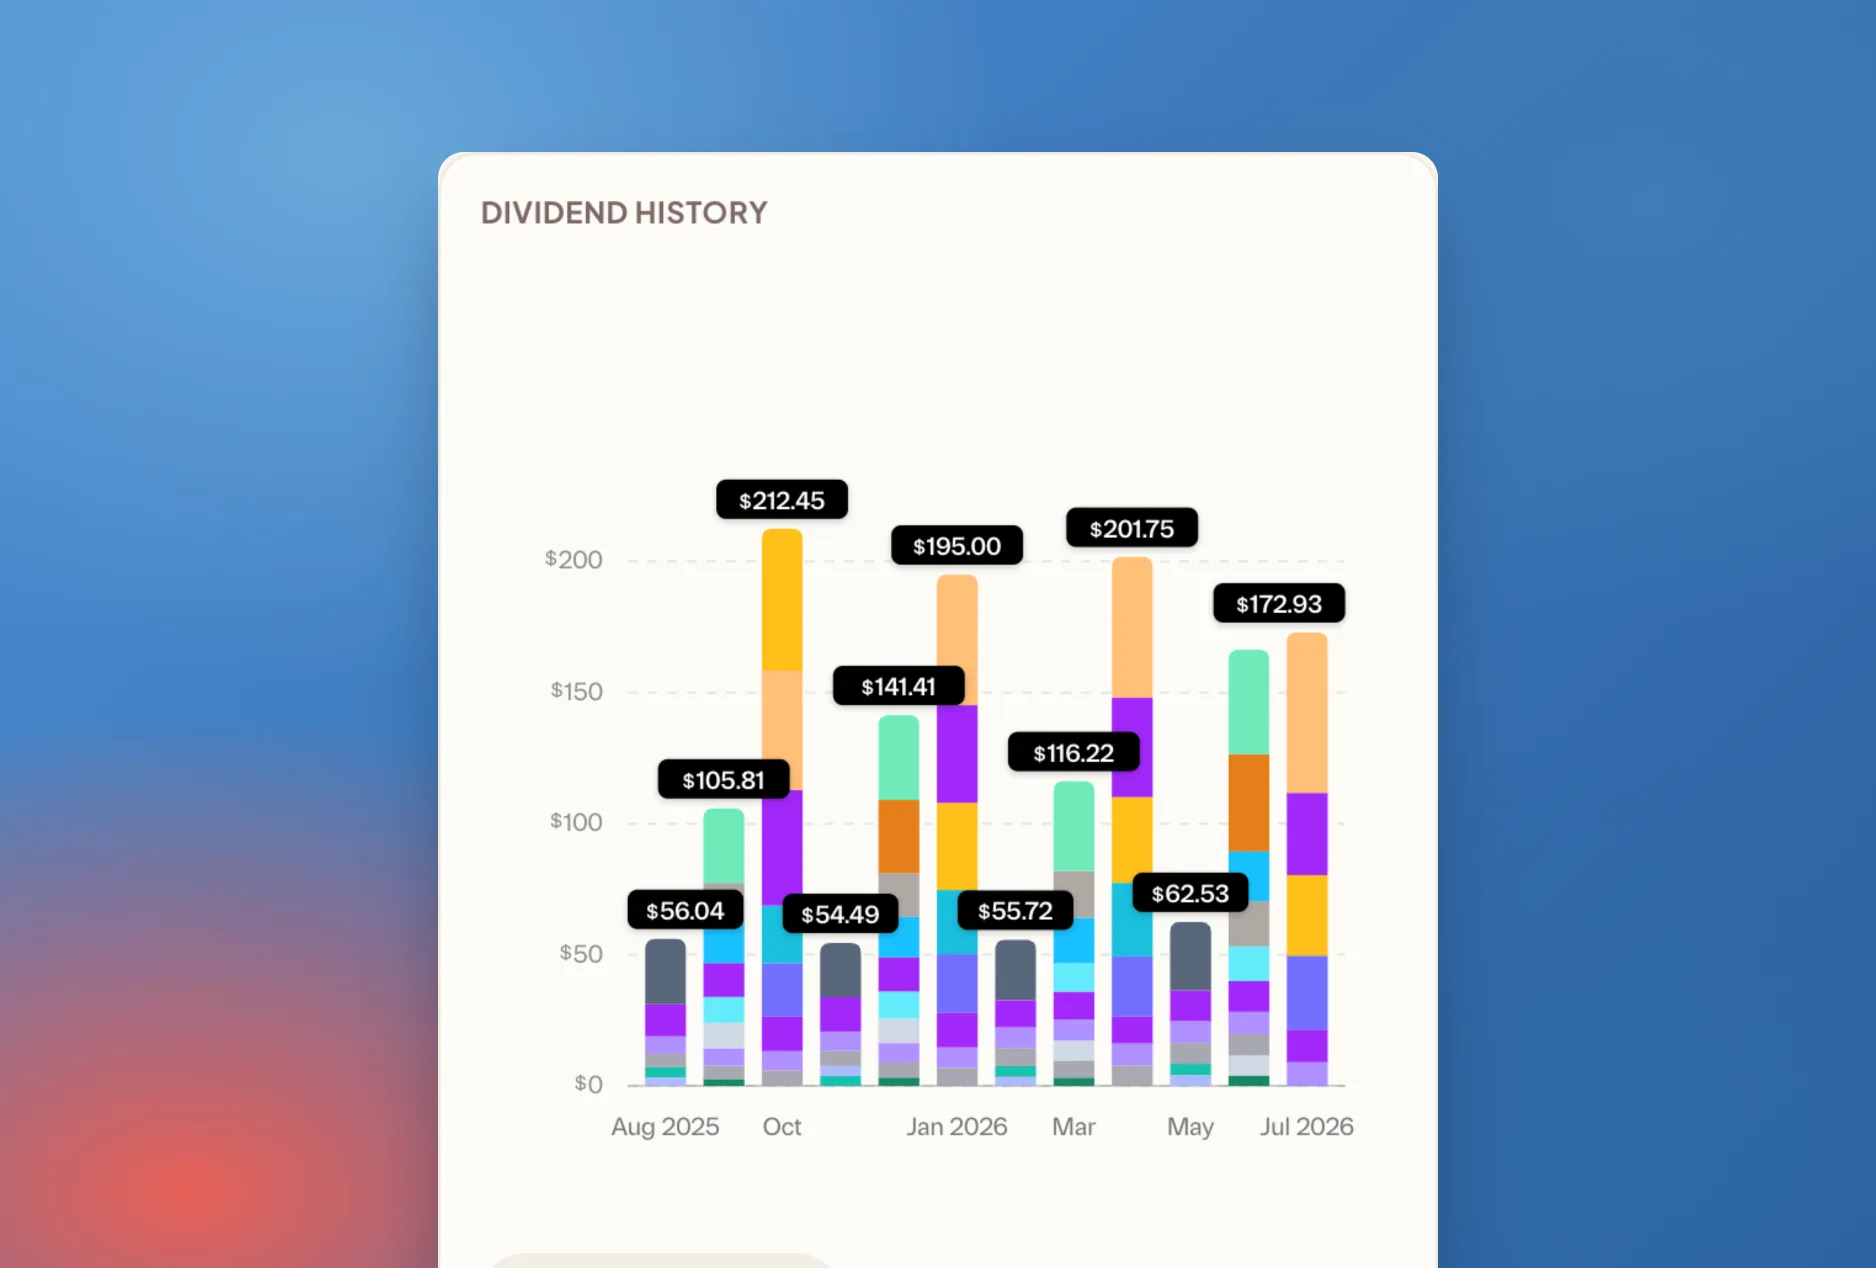
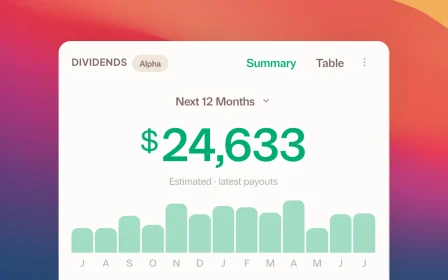
Dividends
Every payout, building an income record you own.
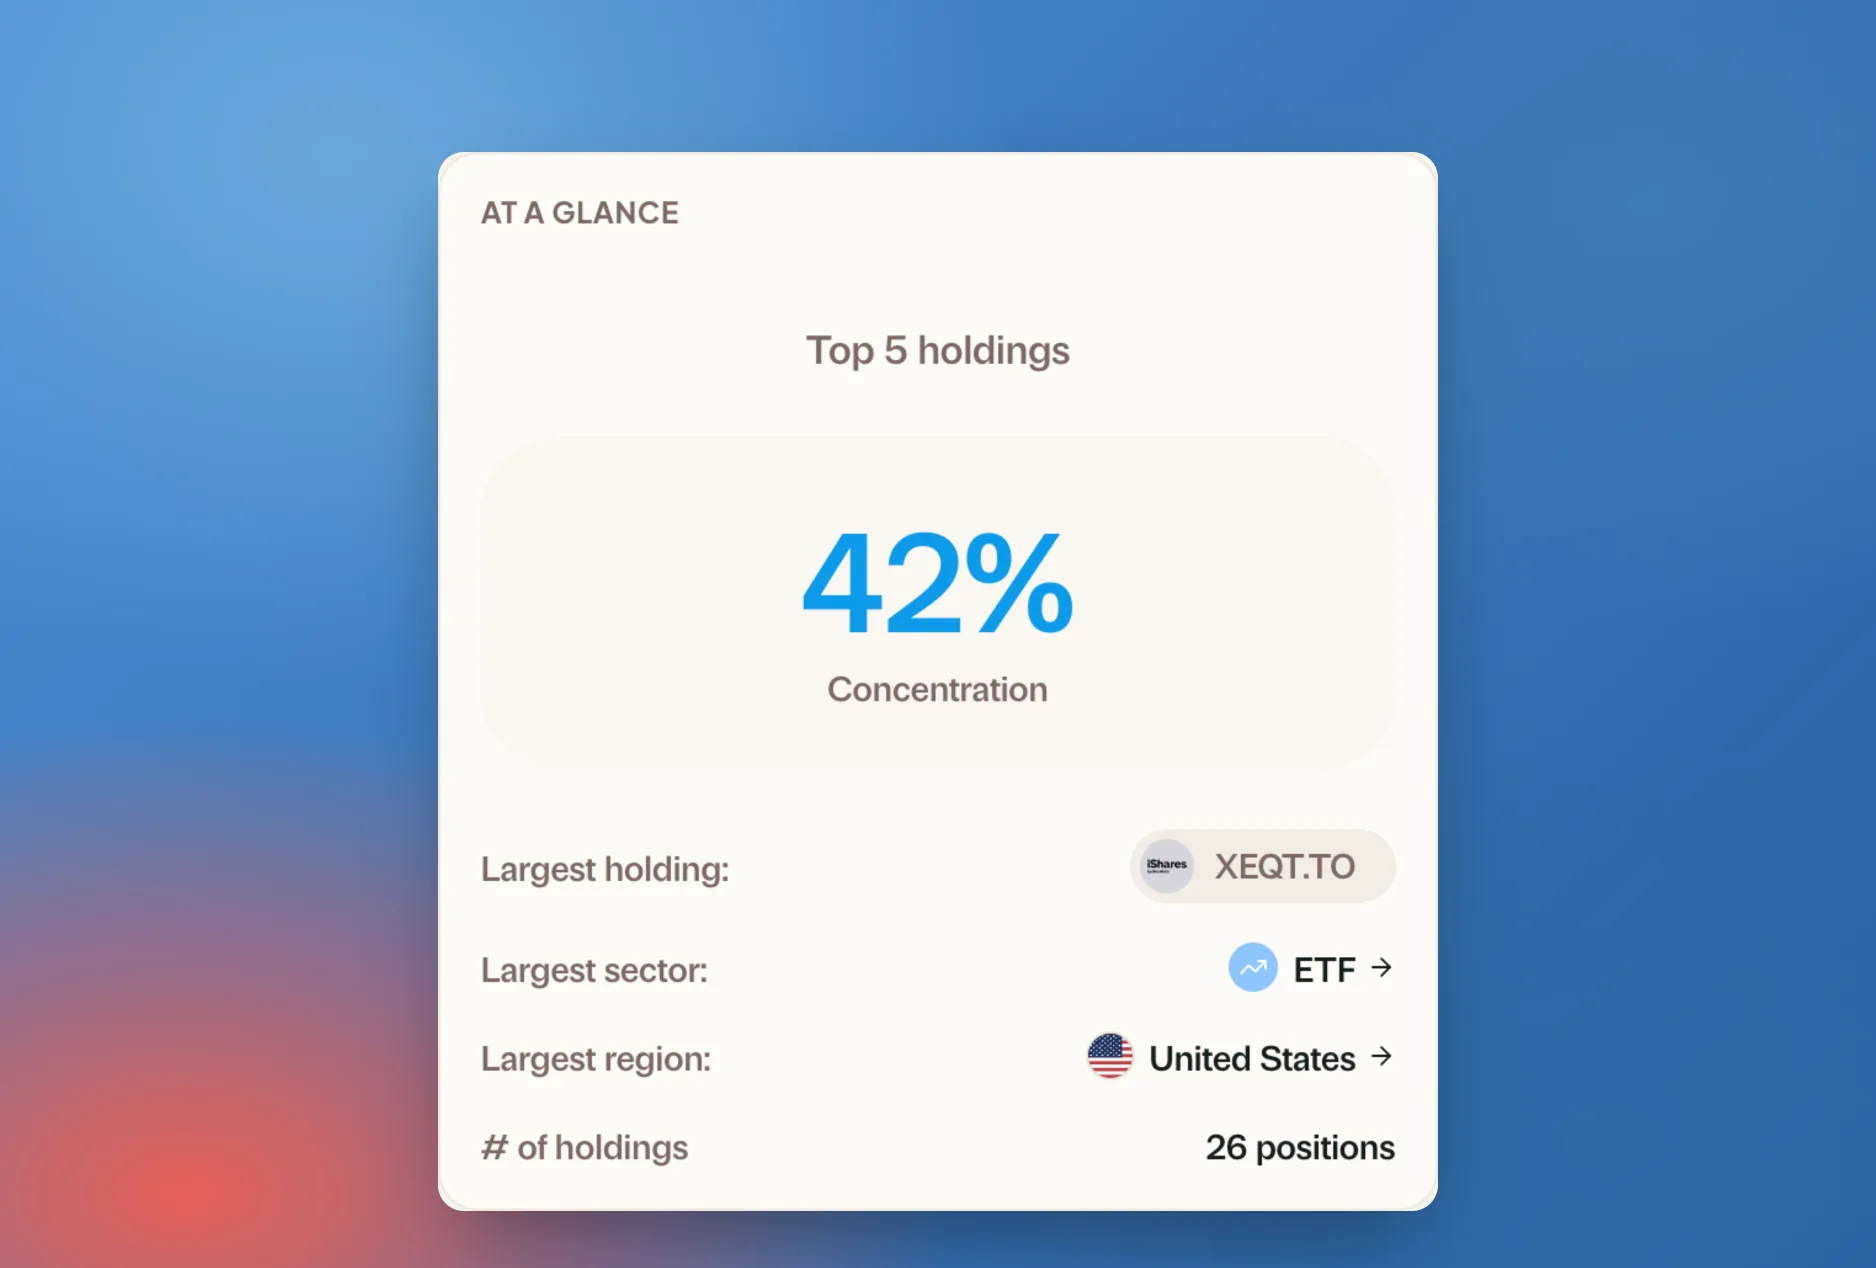
At a glance
Your concentration, largest holding, and position count.
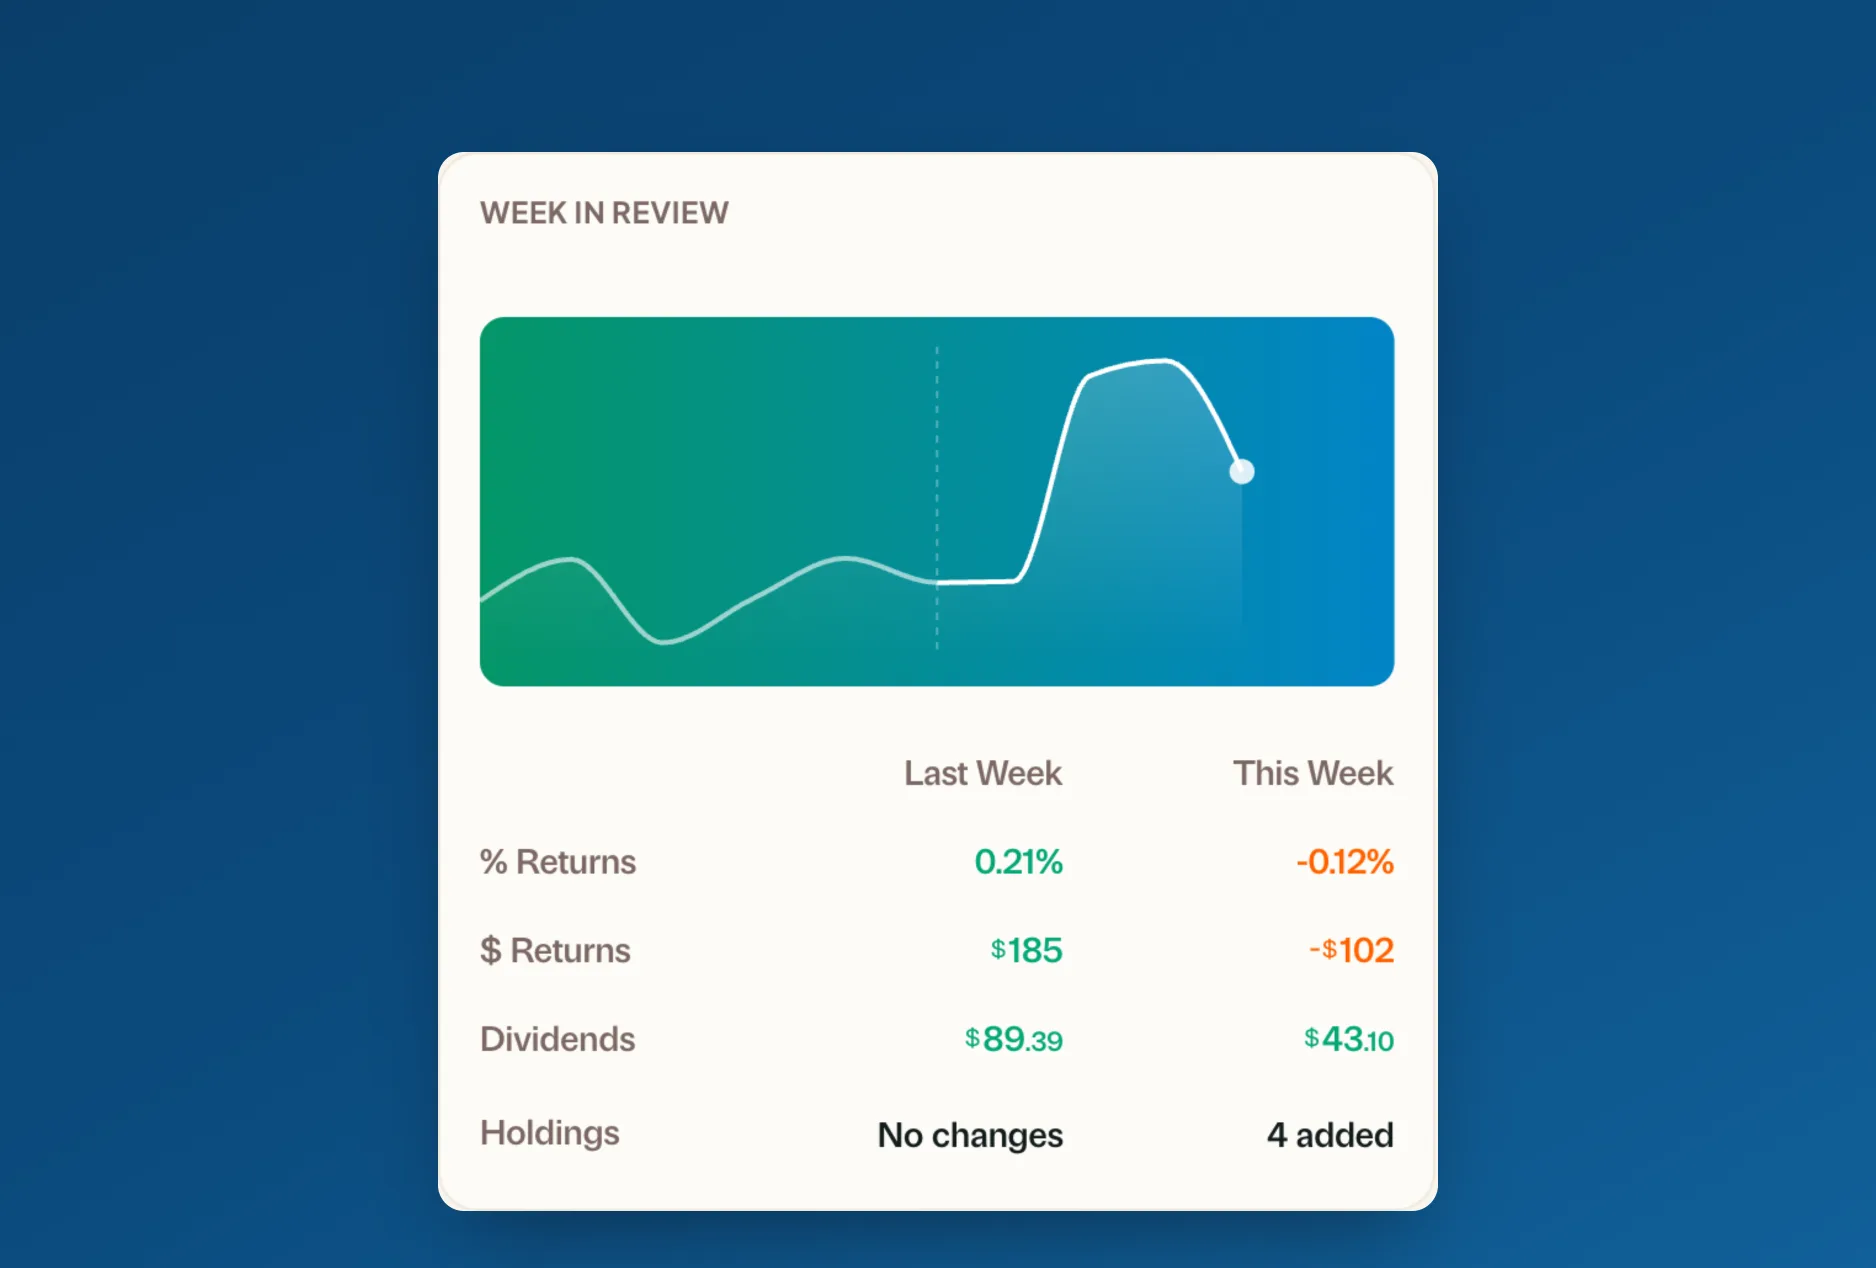
Week in review
How the week actually went, in one card.
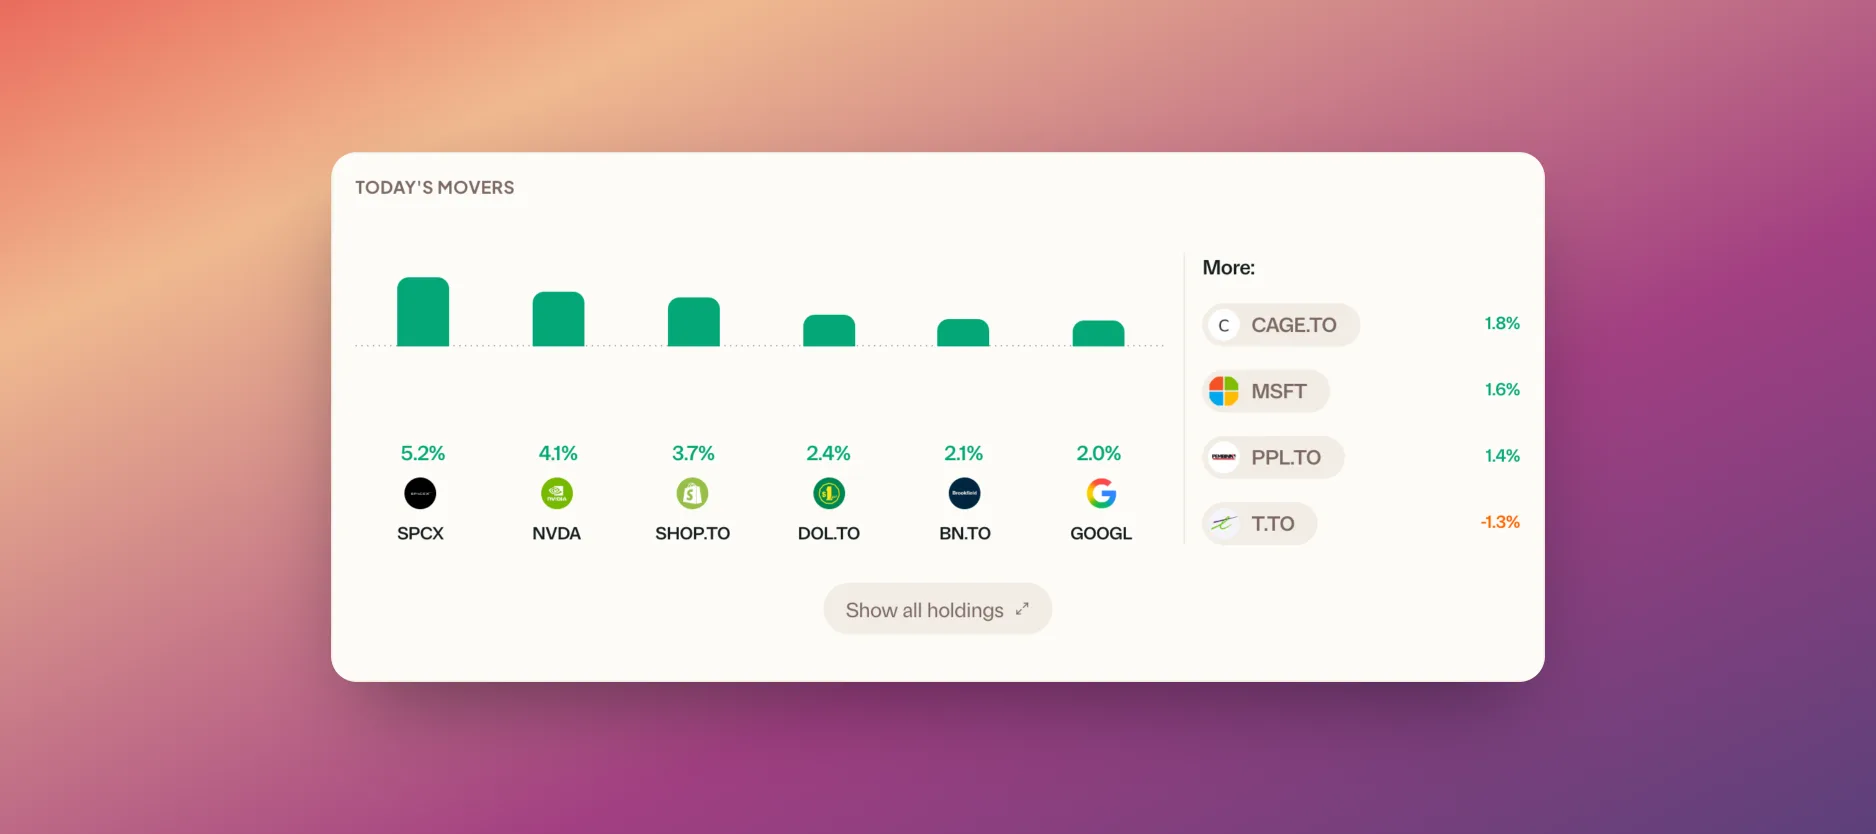
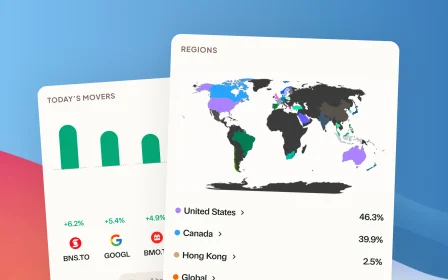
Daily movers
What moved today, and by how much.
Records
Your best holding, sector, and region, by the numbers.
Position milestones
Each holding's peak, its share of your portfolio, and years held.
Peak days
The days your portfolio outdid itself.
Dividends
Every payout, building an income record you own.
At a glance
Your concentration, largest holding, and position count.
Week in review
How the week actually went, in one card.
Daily movers
What moved today, and by how much.
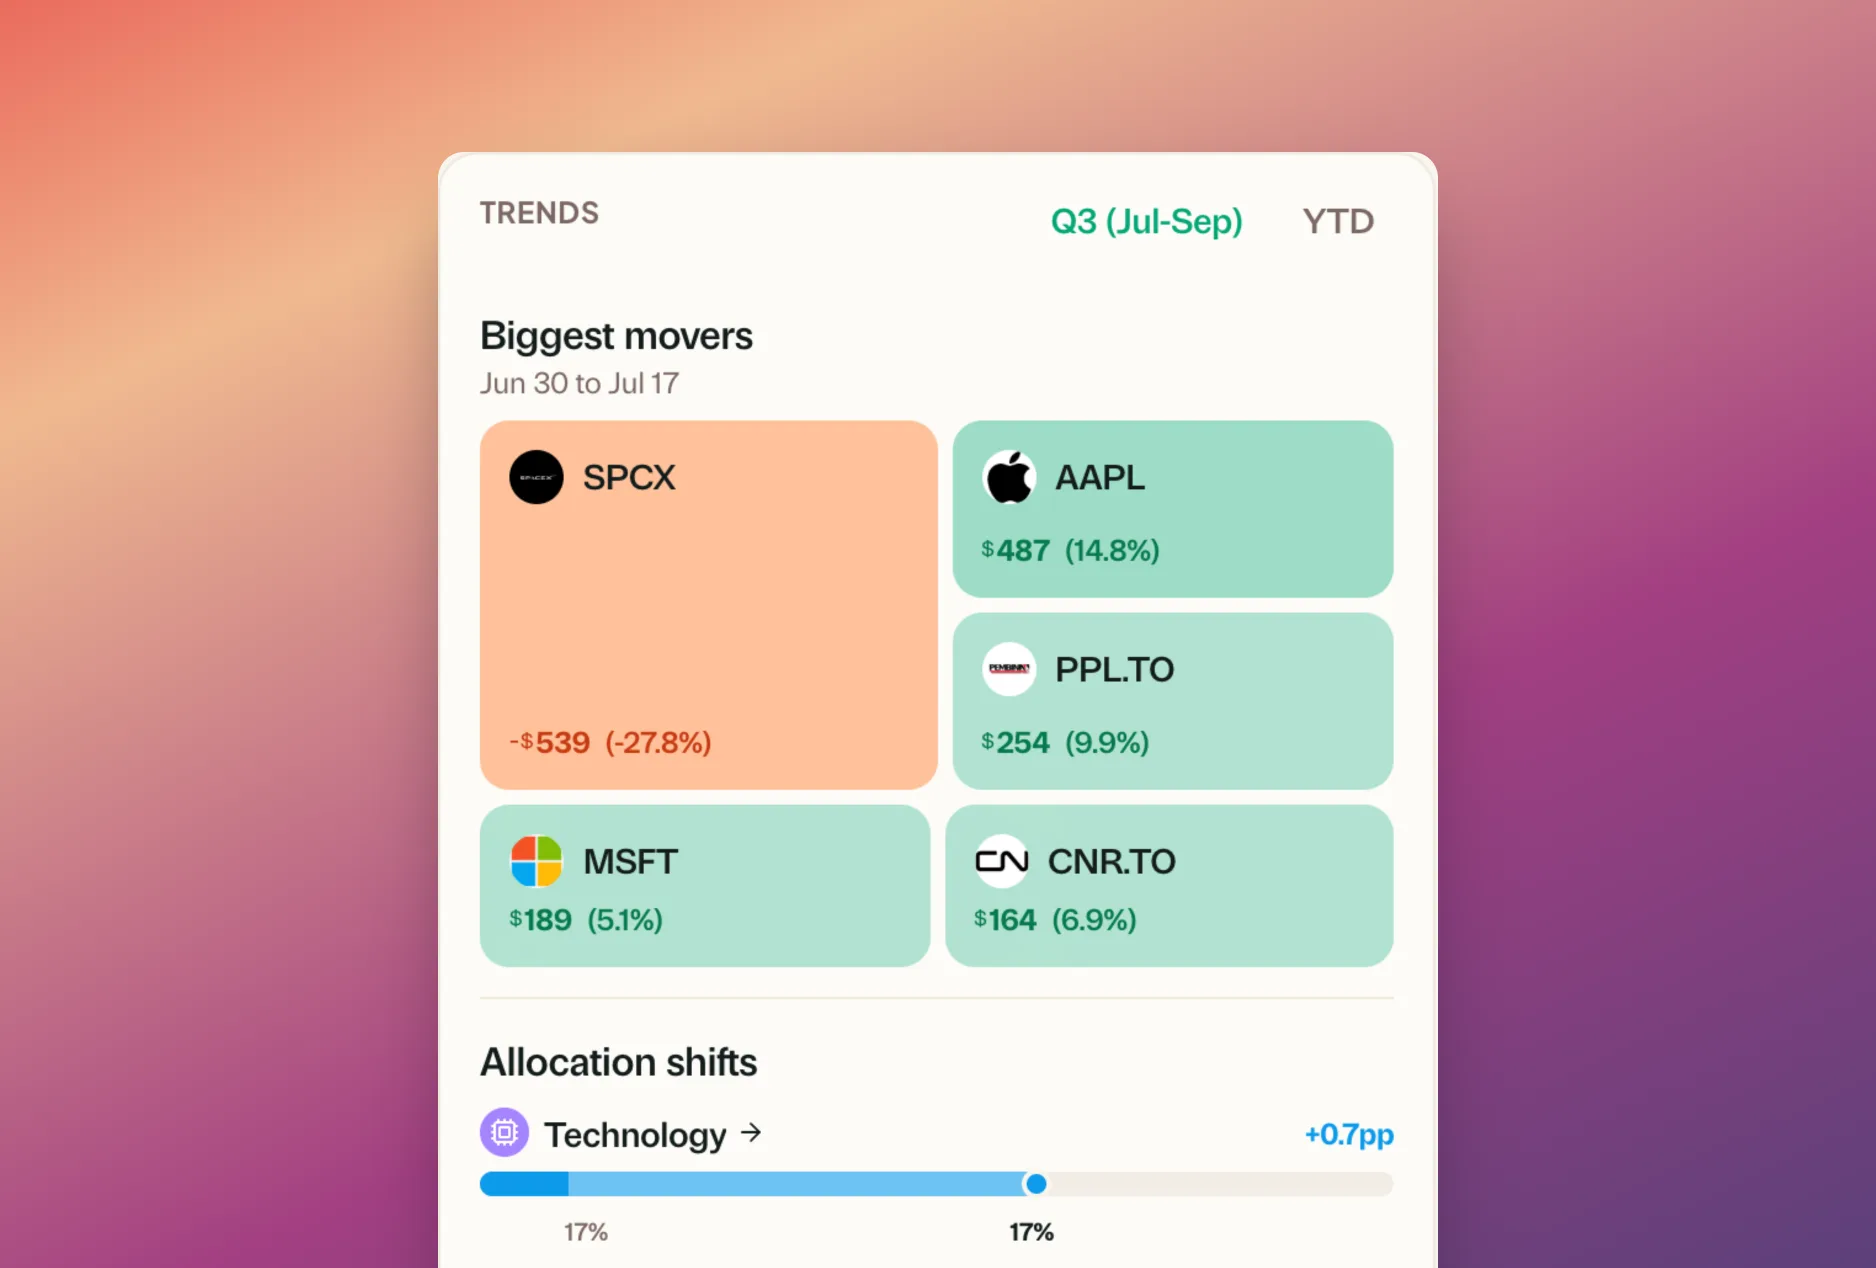
Surface trends in your portfolio
Trends show your biggest movers over the quarter and how your allocation is shifting underneath you, while the shifts are still small.
Shipping next
Deeper answers are coming
Time-weighted and money-weighted returns
The methodology the pros use, on your real portfolio.
Time Machine
What-if scenarios on your actual holdings, not a calculator's.
Retirement and goal projections
Where your money is headed, not only where it is.
Questions, answered
How does Greenline calculate my return?
Your total return compares what your holdings are worth against what you actually put in, including realized gains and dividends. Time-weighted and money-weighted methods are on the way.
Why is my number different from my brokerage app?
Most brokerage apps show your balance, which mixes deposits with growth. Greenline separates the money you added from the money your investments earned.
Which benchmark does Greenline compare against?
The S&P 500 today, alongside a similarity gauge that shows how closely your portfolio follows the market at all.
Does it work across all my accounts?
Yes. Performance is calculated across everything you track in Greenline, and you can also view it account by account.
Where to look next
Track all your accounts
Every account in one portfolio, no bank linking.
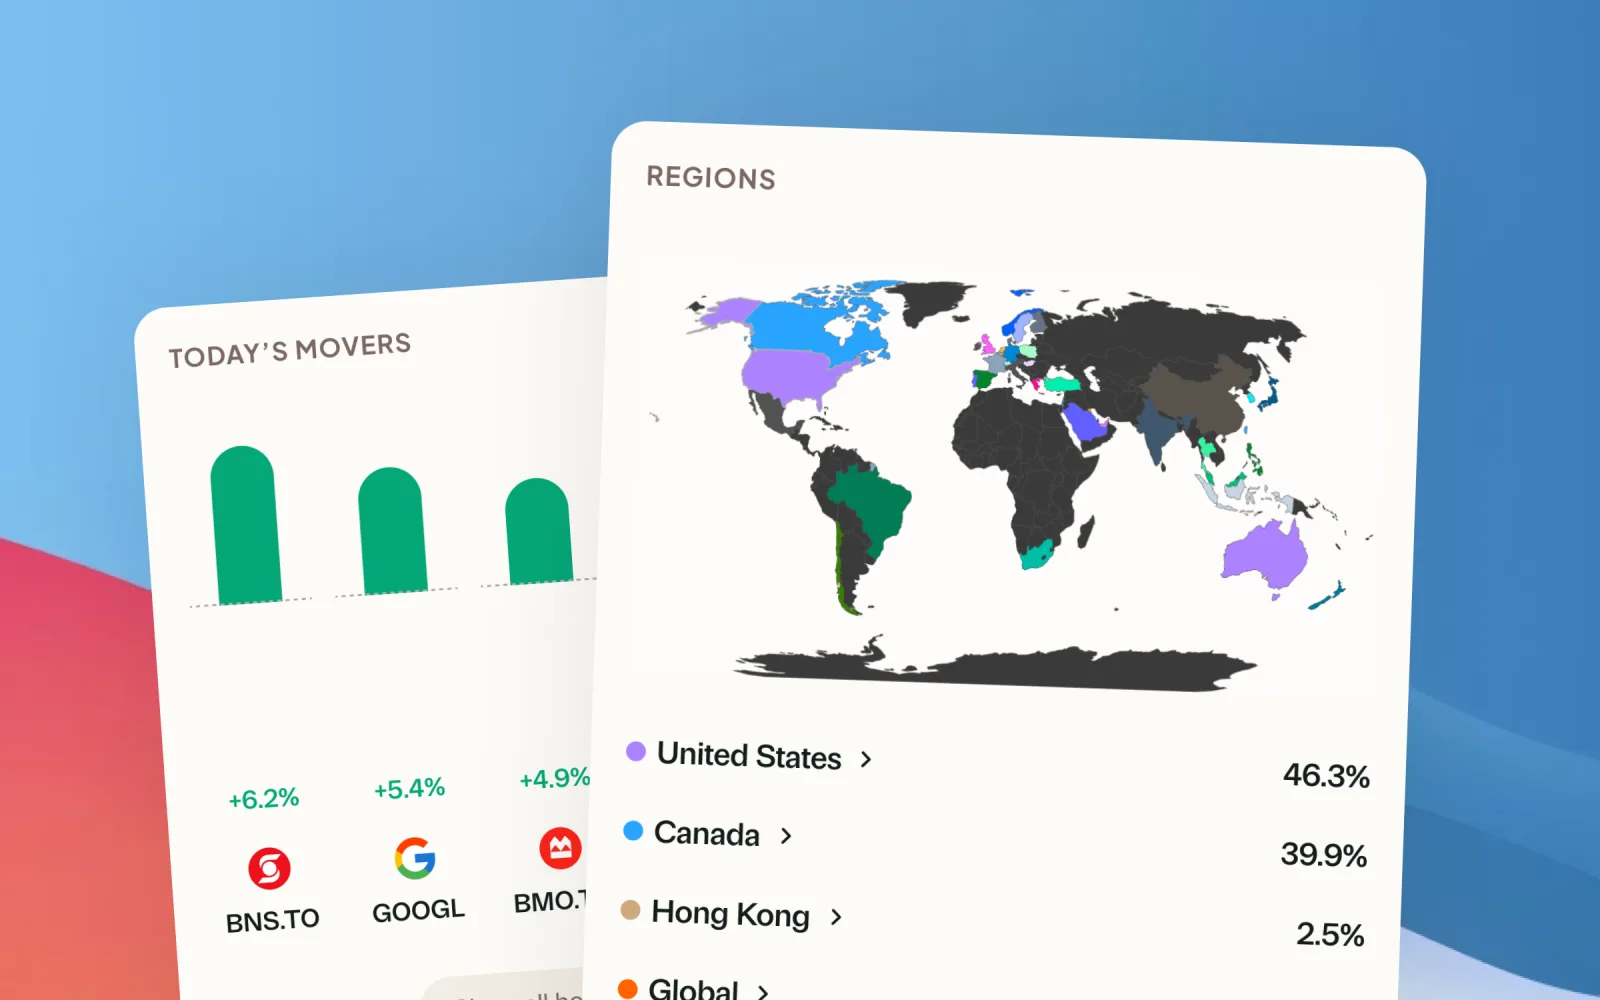
Analyze your portfolio
See every holding up close, and what your ETFs really hold.
See your track record
Your value over time, your records, and year by year.
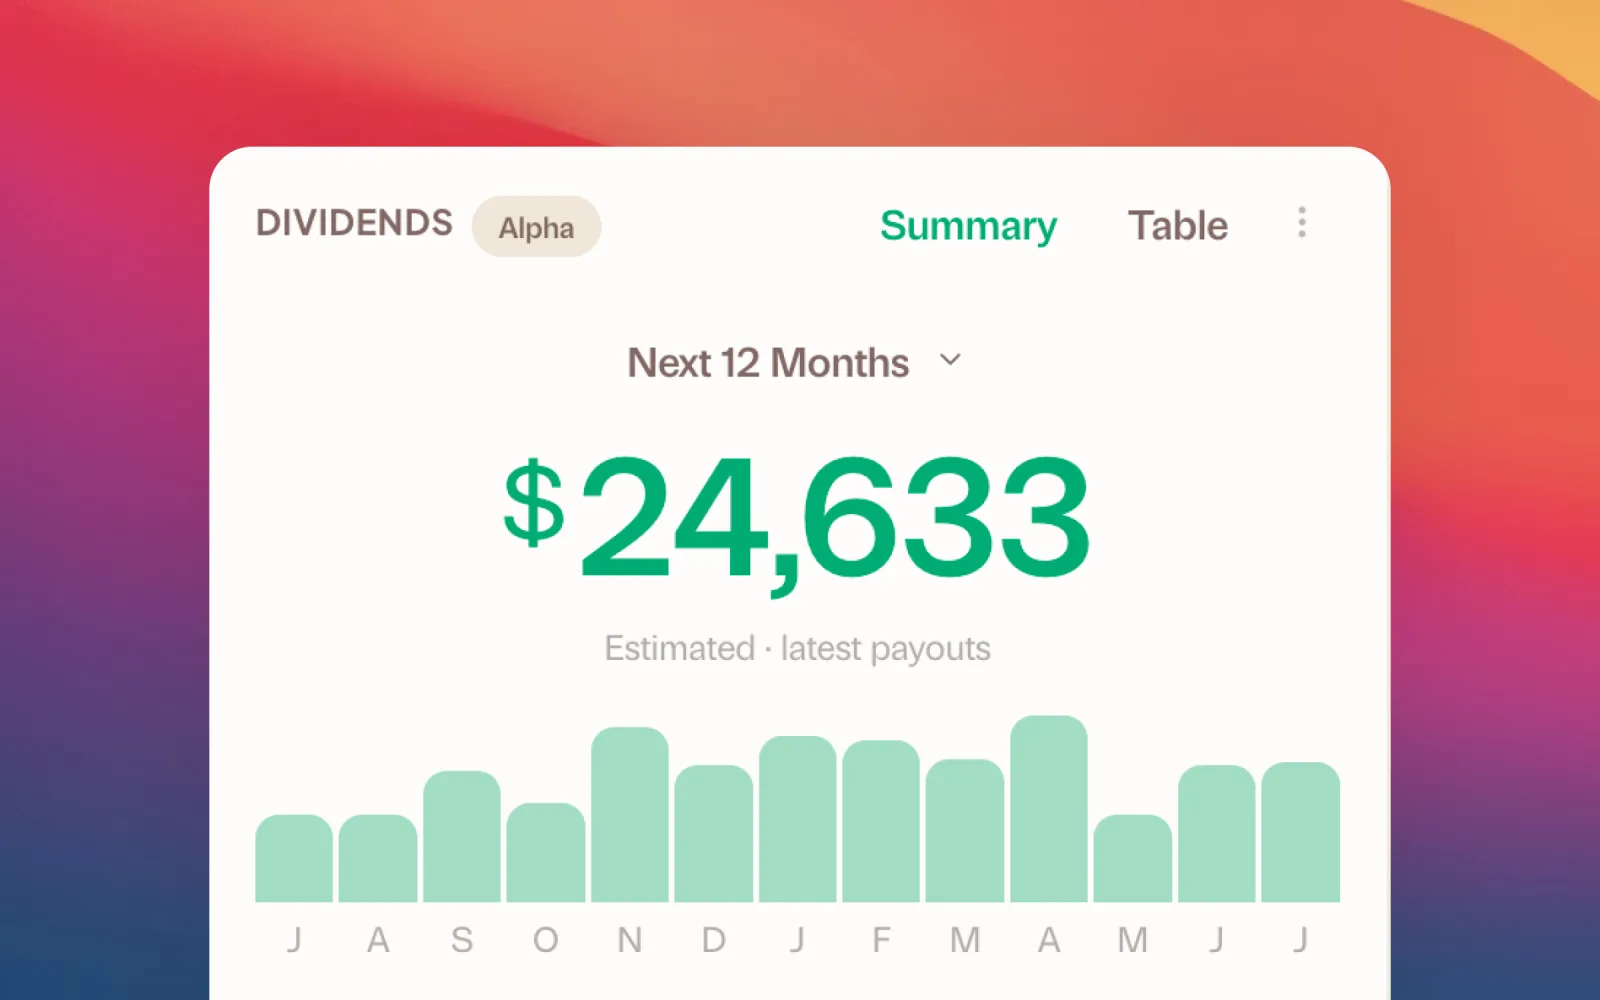
Track your dividends
Estimated payouts ahead, a clean record behind.
Continue the story
Understand your capital gains
ACB and gains, tracked as you go.
Track all your accounts
Every account in one portfolio, no bank linking.
Analyze your portfolio
See every holding up close, and what your ETFs really hold.
See your track record
Your value over time, your records, and year by year.
Track your dividends
Estimated payouts ahead, a clean record behind.
Continue the storyUnderstand your capital gains
ACB and gains, tracked as you go.
Ready to know exactly what you own?
See your full portfolio, freeFree during Beta. Early Members will be offered better rates than new users when we launch paid plans.