
Fee Analysis
Know exactly what you're paying, in dollars, every year.
Most investors don’t know what they’re paying in fees. Not because the information is hidden, but because it’s scattered across fund fact sheets, brokerage statements, and fine print that nobody reads.
Greenline pulls it all together. Upload your statements and you’ll see exactly what every holding costs you, across every account.
What Greenline shows you
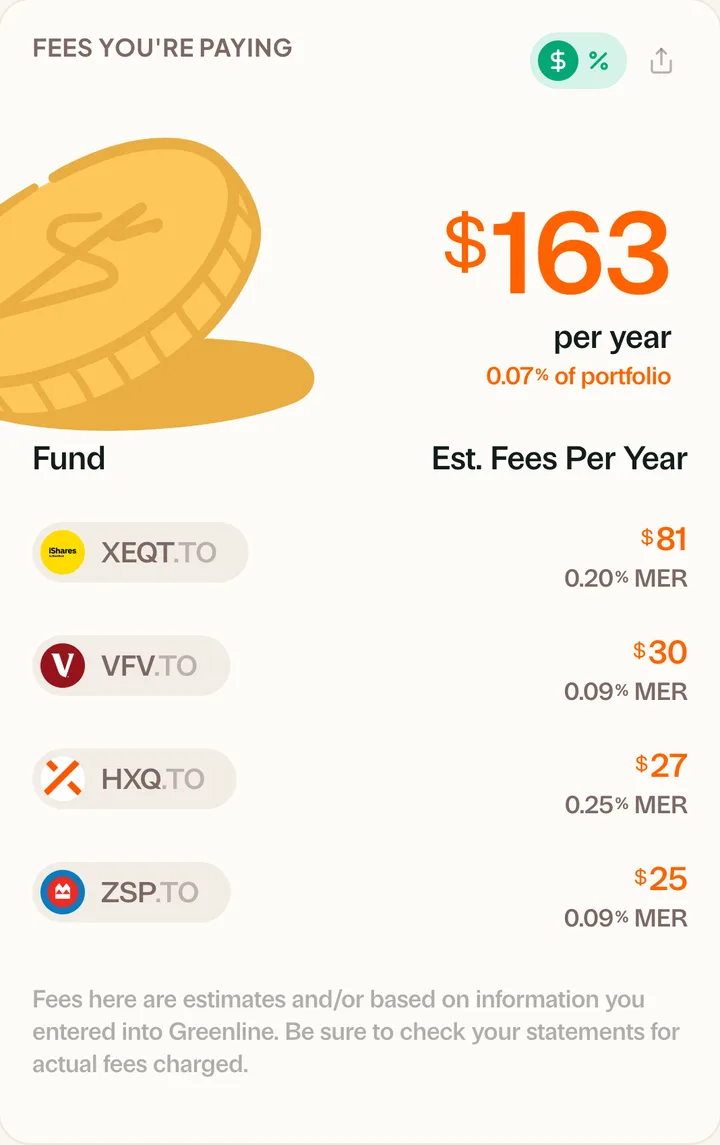
For each holding in your portfolio, Greenline displays:
- Management Expense Ratio (MER): the annual percentage your fund charges, pulled automatically from fund data
- Dollar cost: what that percentage actually means in dollars each year, based on your holdings
This isn’t an estimate based on your account balance. It’s calculated from your actual holdings, weighted by how much you own of each one.
Why fees matter more than most people think
A 1% difference in fees sounds small. Over 25 years on a $100,000 portfolio, it’s the difference between roughly $60,000 in fees paid versus $15,000. That’s $45,000 that either compounds for you or goes to your fund manager.
According to Morningstar’s 2025 Canada Fund Fee Study, the average Canadian mutual fund charges 1.33% a year. Broad index ETFs often charge around 0.2%. Most investors can’t name what they pay. You will.
Greenline doesn’t tell you to switch. It just shows you the numbers and lets you decide.
How it works across multiple accounts?
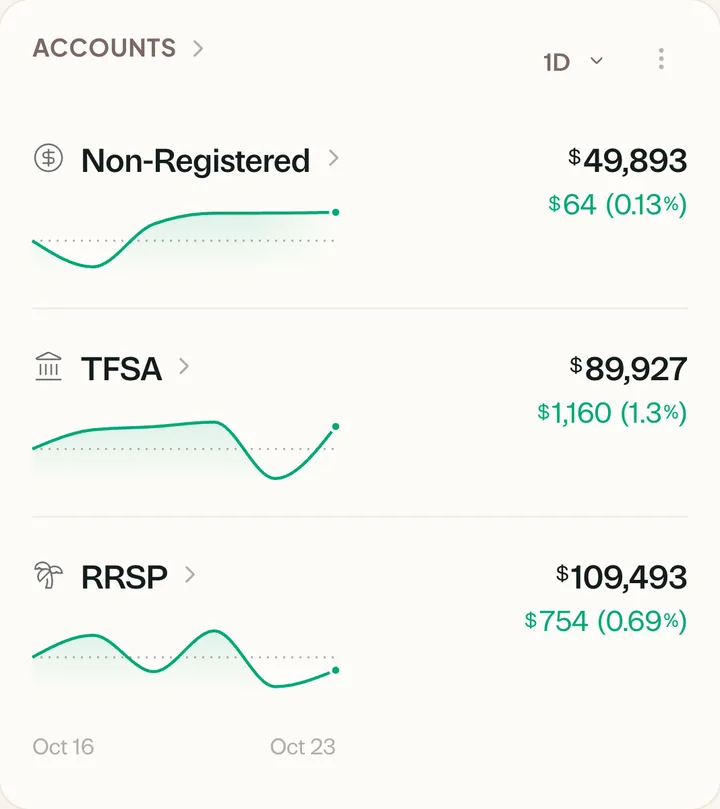
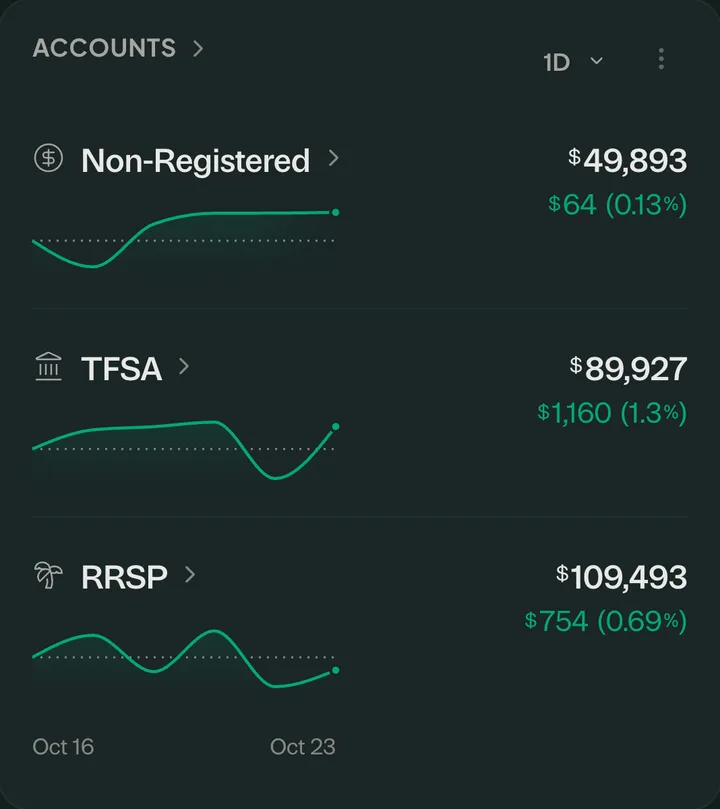
If you have investments at more than one brokerage, Greenline combines the fee picture across all of them. You might have low-fee ETFs in your self-directed TFSA but still hold a high-fee mutual fund in a group RRSP through work.
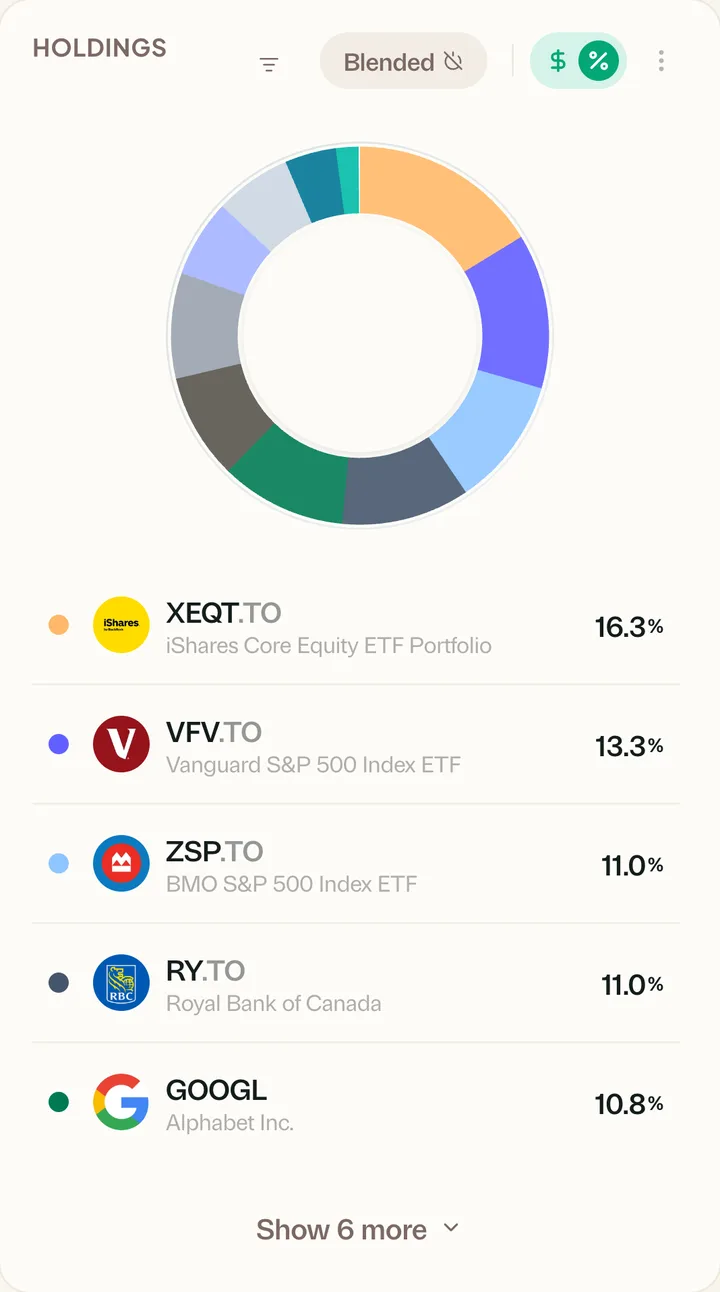
Greenline shows you the blended fee rate across your entire portfolio, so you know what you’re actually paying in total, not just account by account.
What about trading commissions?
You can record the commission on each trade you log. The fee breakdown itself covers your ongoing fund costs (MERs), not commissions.
Related reading
What you're actually paying in investment fees

Are ETFs actually better than mutual funds?
Small percentages, big differences
What you're actually paying in investment fees
Too many investors have no idea what they're paying in fees. MERs, trading commissions, currency conversion. Here's where your money is quietly going.
Are ETFs actually better than mutual funds?
Small percentages, big differences
See your full financial picture in one view.
See your full portfolioFree during Beta. Early Members will be offered better rates than new users when we launch paid plans.