Understanding Your Dashboard
Last updated: 2026-08-22
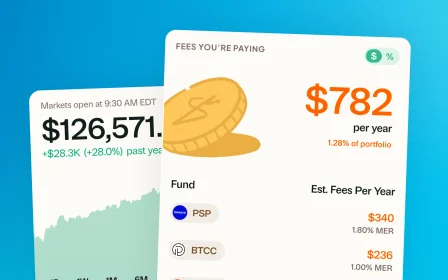
The Today page is your portfolio at a glance. Every time you open Greenline, this is what you see first.
The top of the page
- Total portfolio value. The big number. Everything you’re tracking, combined.
- Change. What that value has done, in dollars and percent, over the timeframe you’ve picked. It opens on today by default, and you can change that in Settings.
- The chart. Your value over the same timeframe. Tap a different timeframe to redraw it. More on this in Tracking your portfolio over time.
Below the chart
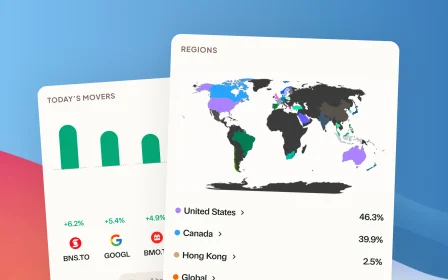
- Biggest movers. Which of your holdings moved most today.
- Goal. Progress towards a target, if you’ve set one.
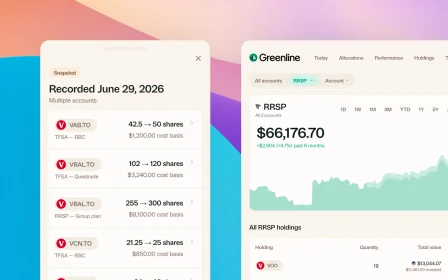
- Accounts. Each account with its current value and change. Tap one to open it and see what’s inside.
- Week or month in review, and at a glance. A short summary of what happened, and the numbers worth knowing.
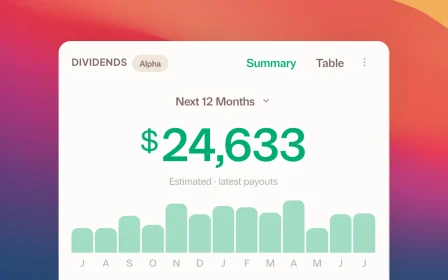
- Upcoming dividends and your dividend history.
- Watchlist. Tickers you’re keeping an eye on but don’t own.
On a computer, accounts and your watchlist sit in a sidebar on the right and stay put as you scroll. On a phone, everything stacks in one column.
Where allocation lives
Your asset mix isn’t on this page. It’s under Portfolio, then Allocations, along with your sector and geographic breakdowns. See Understanding your allocations page.
Still need help? Reach out at support@usegreenline.com.
Still having trouble?
Reach out and we'll help you get set up. We usually reply within a day.
Email support@usegreenline.com