Analyze your finances in any direction
You own more than a list of tickers. See every holding up close, what your ETFs are really made of, and how it all balances out.
See your full portfolio, free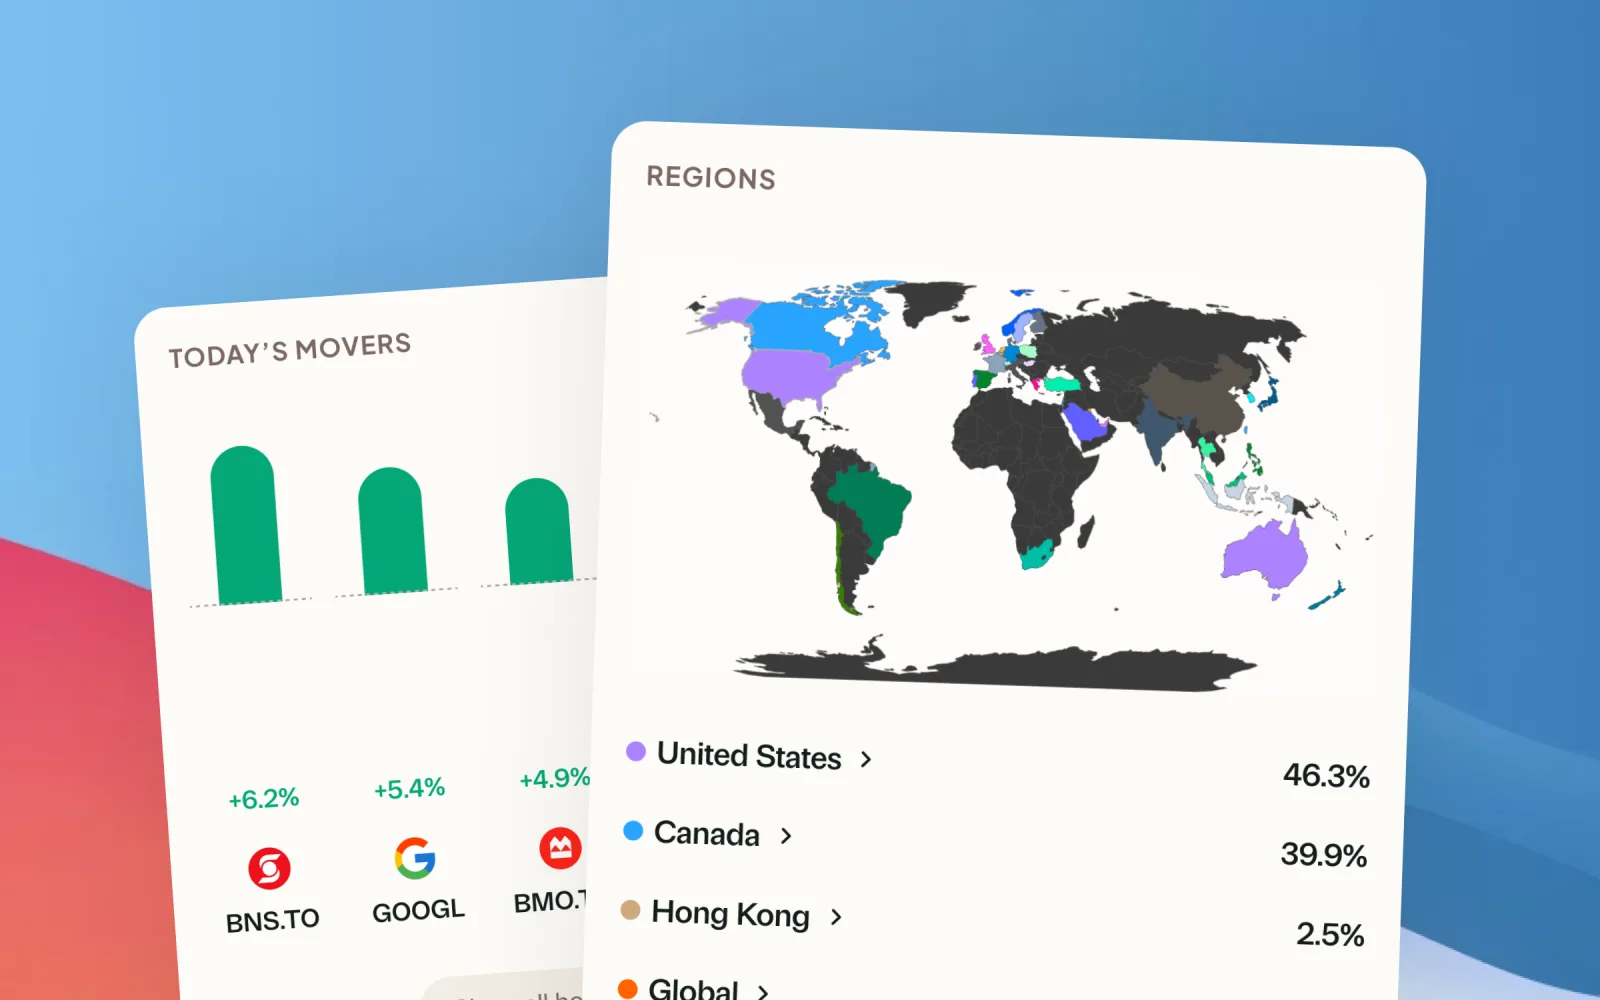
Every holding, up close
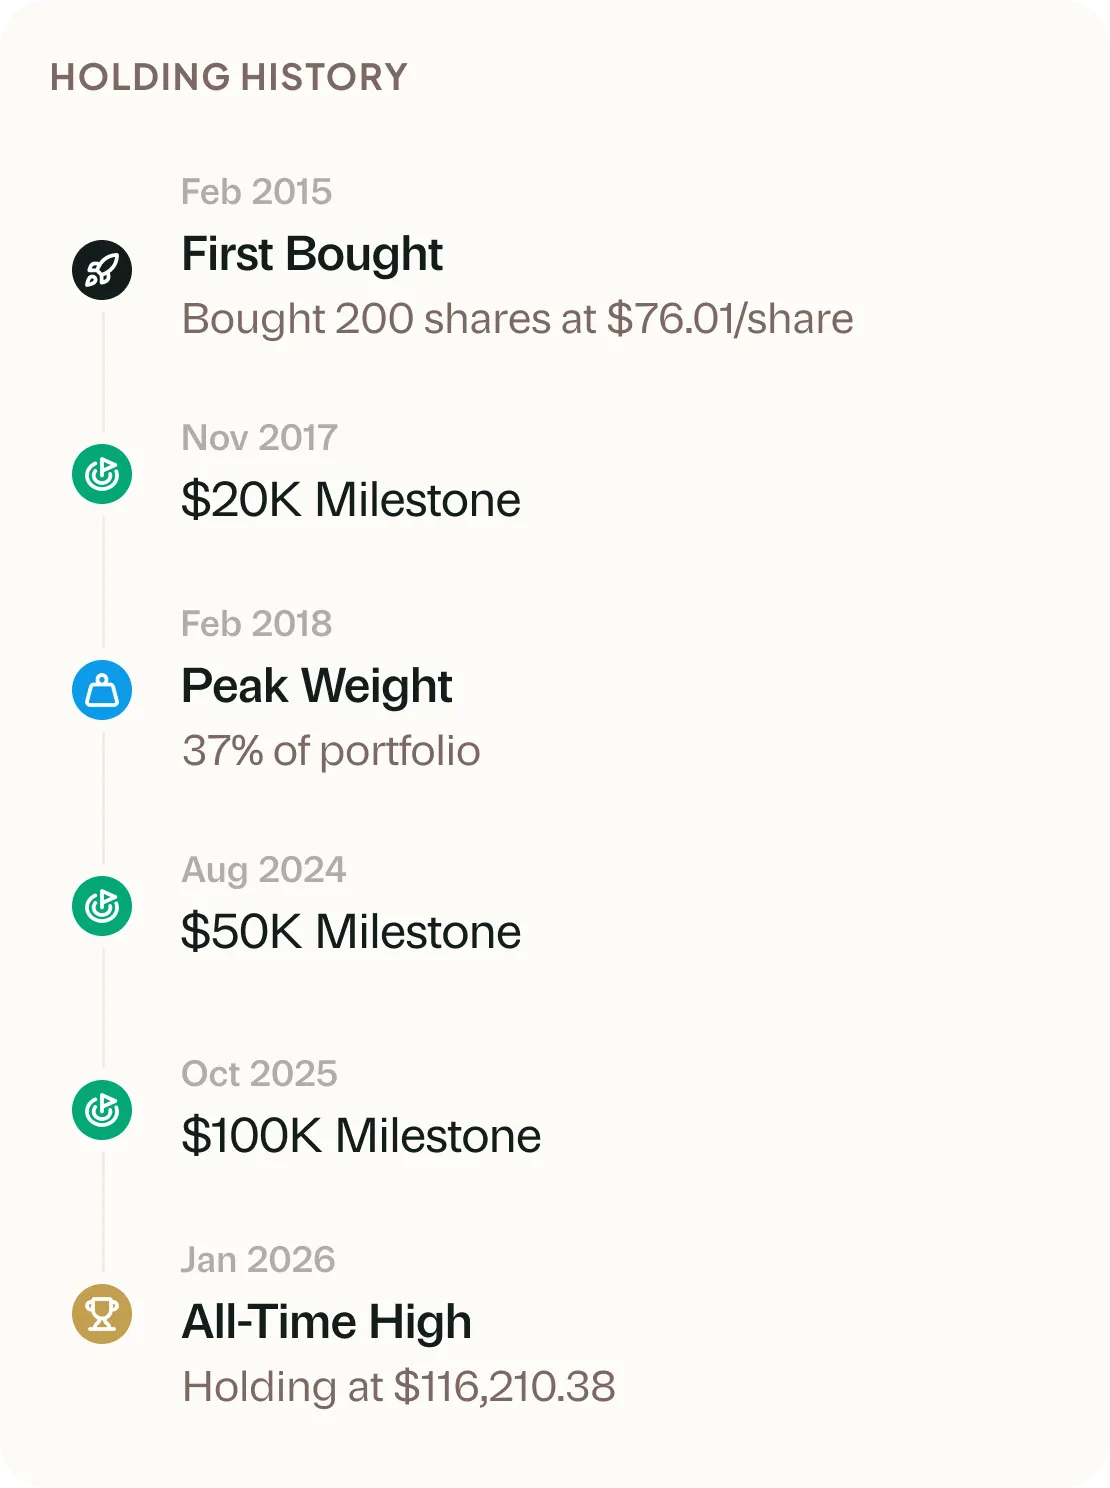
Open any position and see the whole story: your return broken into its parts, every purchase lot, and how it has behaved since the day you bought it.
Your returns, itemized
Unrealized, realized, and dividends, next to your book cost.
Purchase lots
Each buy tracked separately, with its own cost and performance.
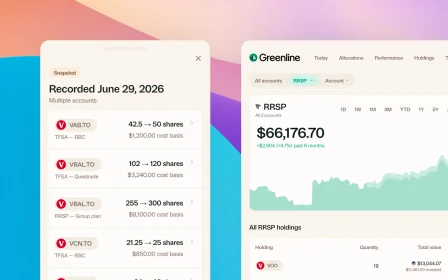
Held across accounts
One holding, every account it lives in, one view.
See through your ETFs
An ETF is a container. Greenline looks inside every one you own, so "diversified" is something you can check, not hope.
Your real exposure
Fund holdings blended into what you actually own.
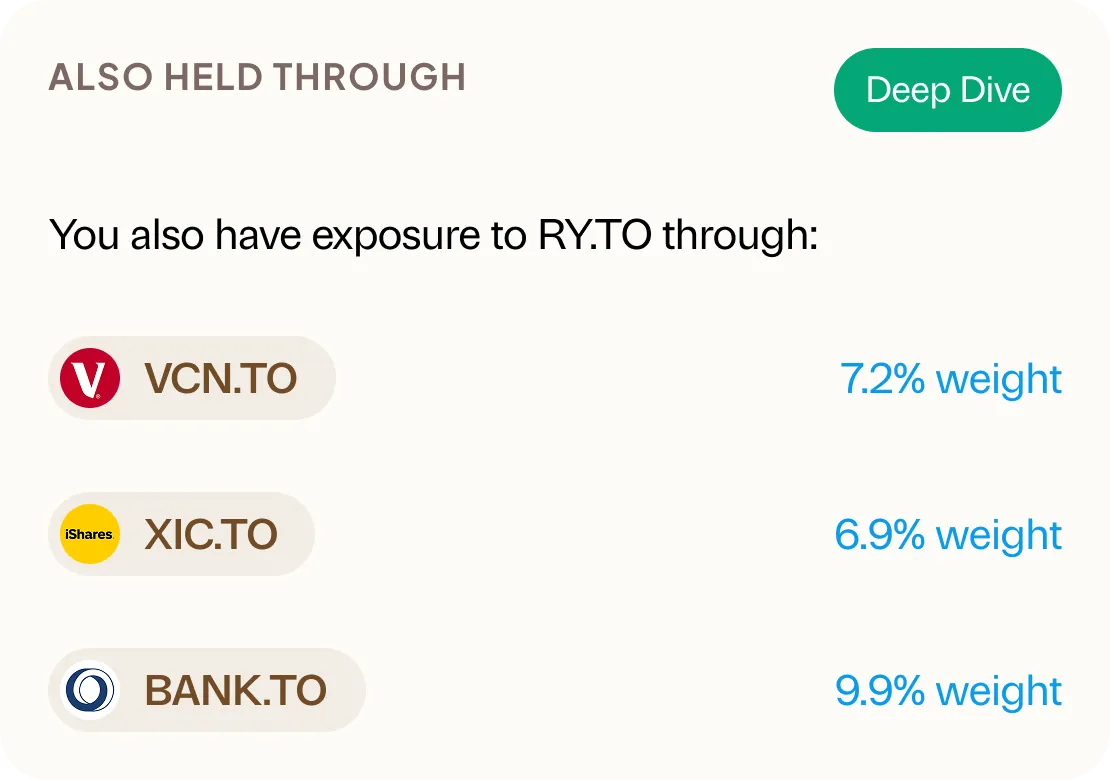
Overlap, surfaced
Own a stock directly and through a fund? You'll see it.
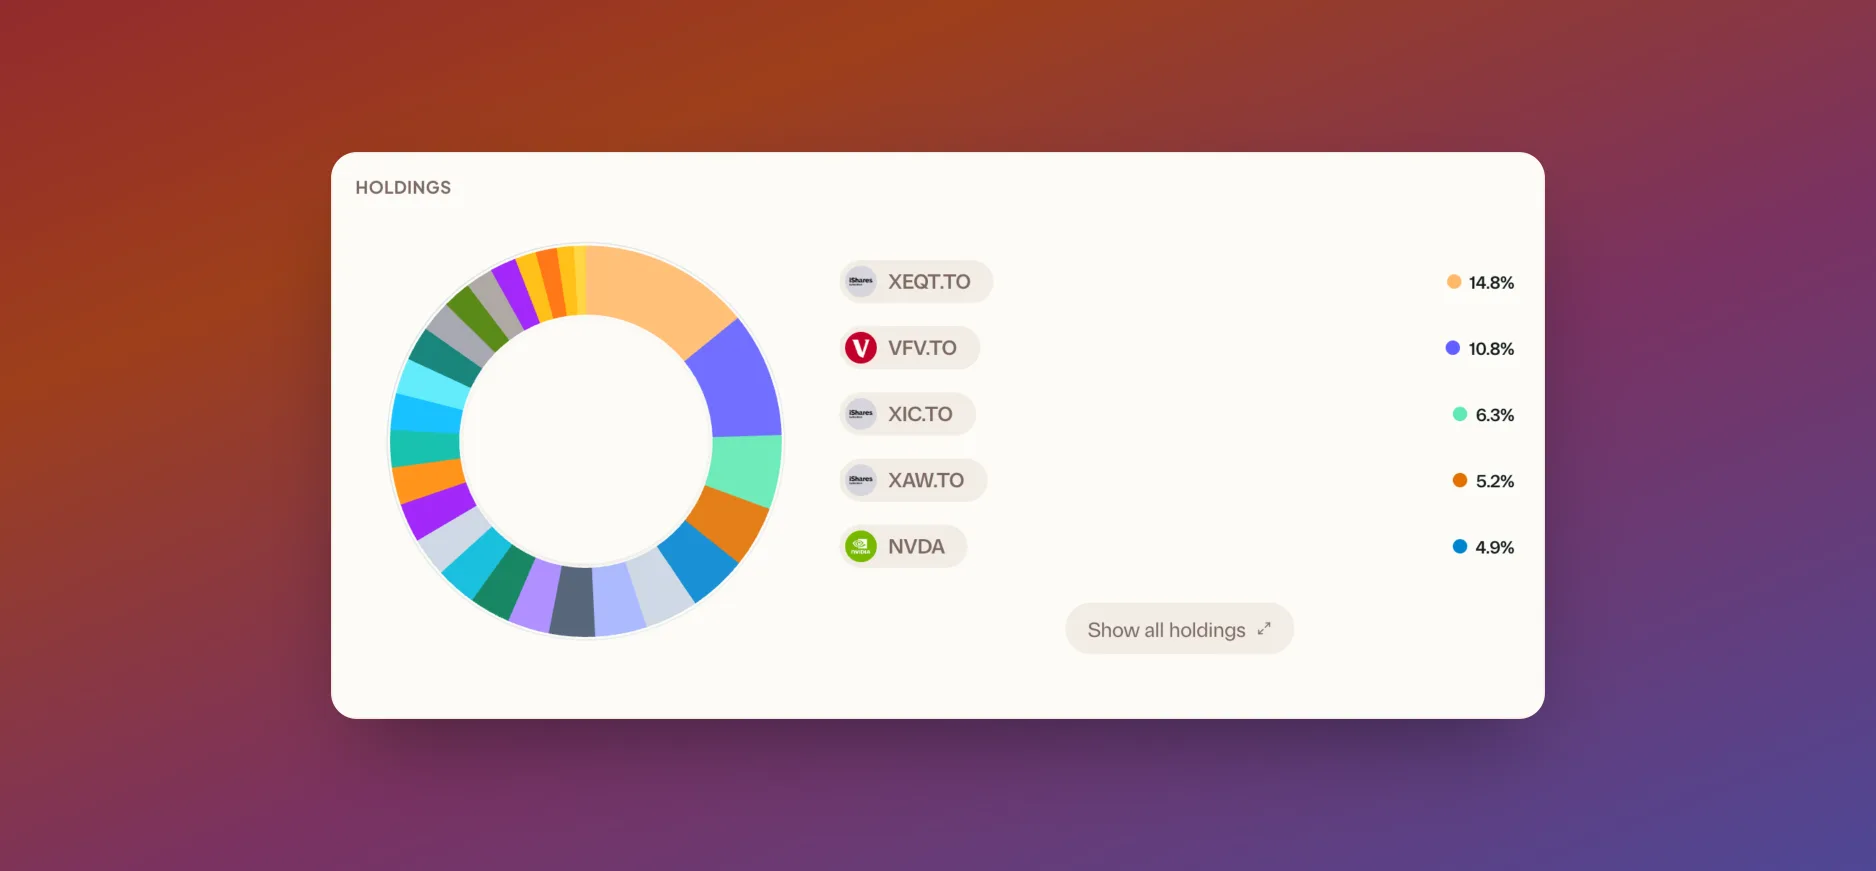
You might think you're diversified because you've got four different ETFs. Then you find out they have all the same holdings.
How it all balances out
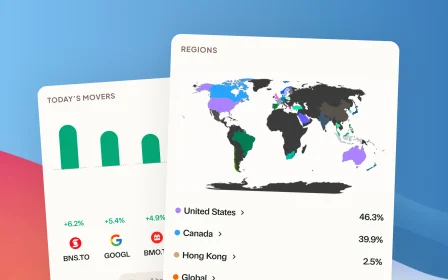
Sectors, regions, and currencies, blended across every account and every fund.
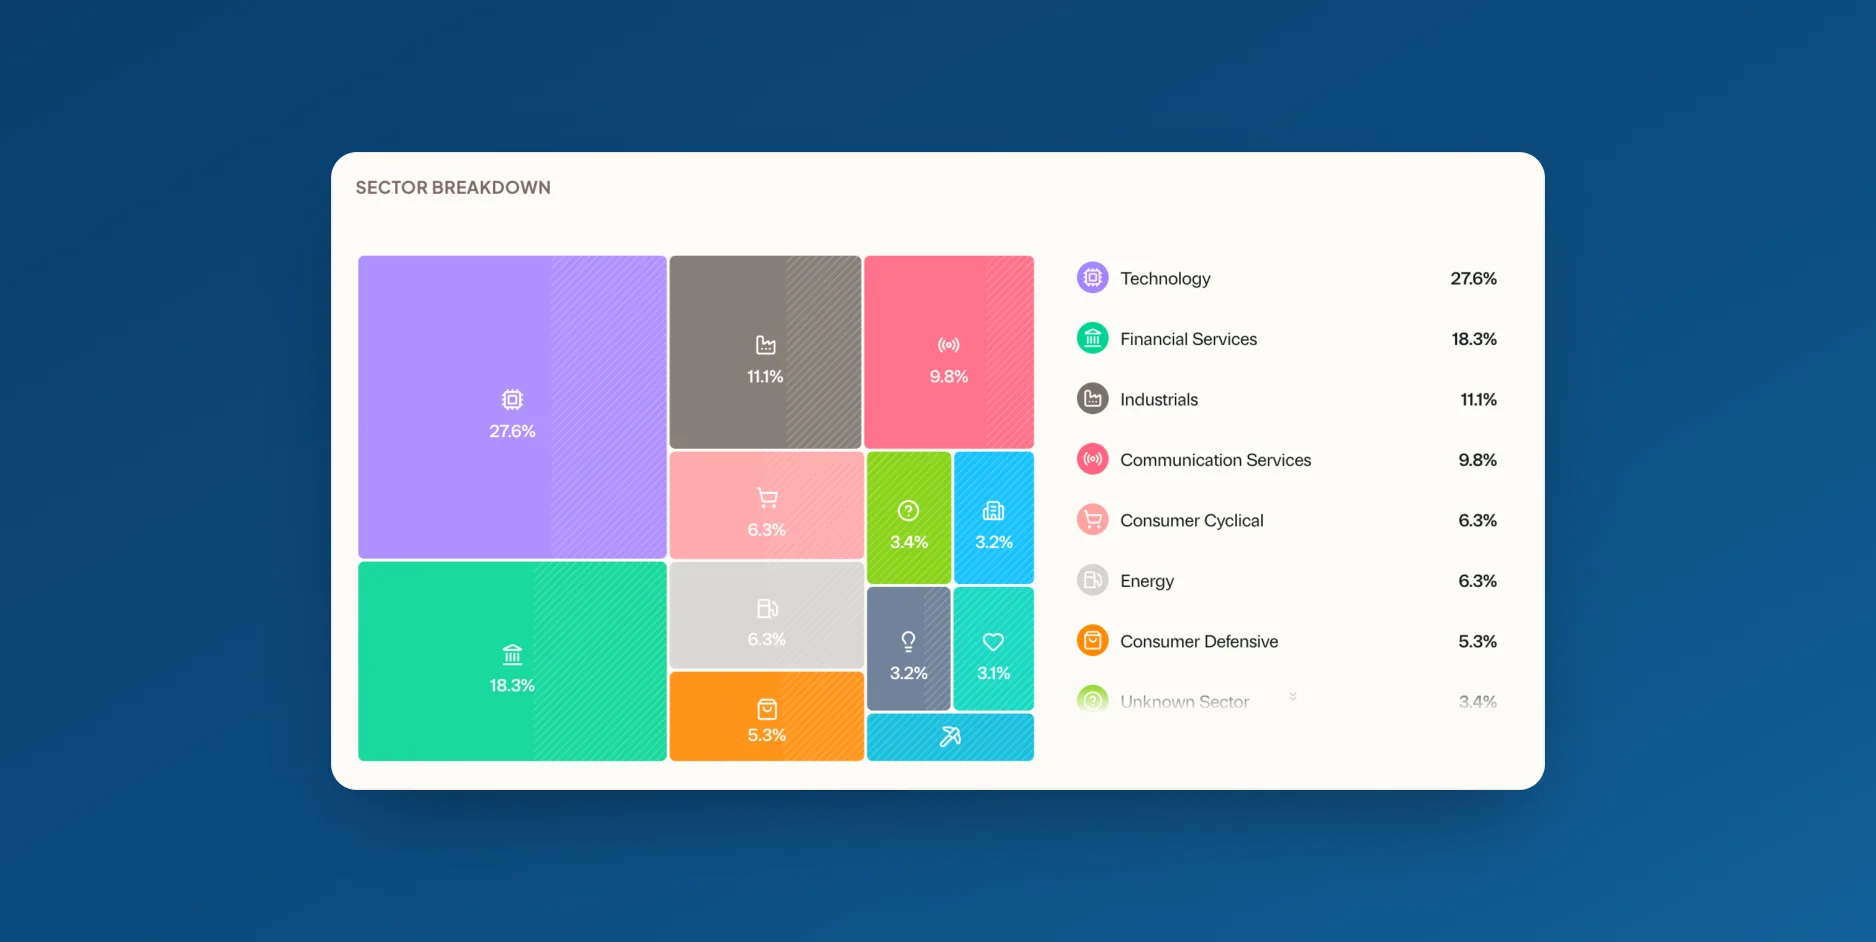
Sectors
Where your money actually works.
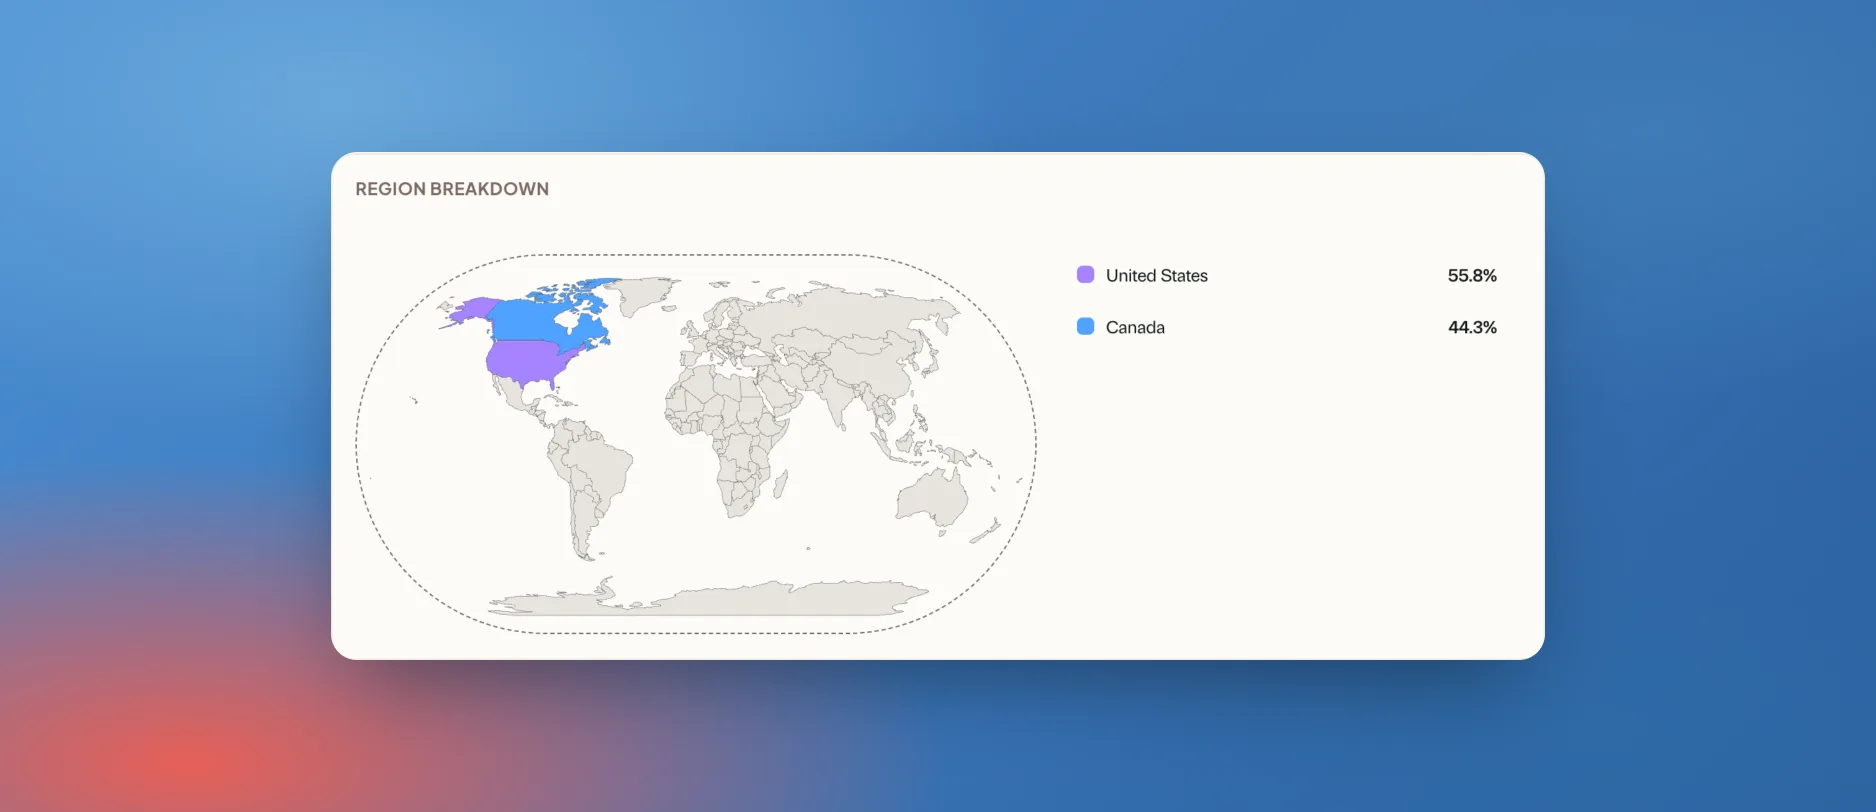
Regions
Canada, the US, and everywhere else.
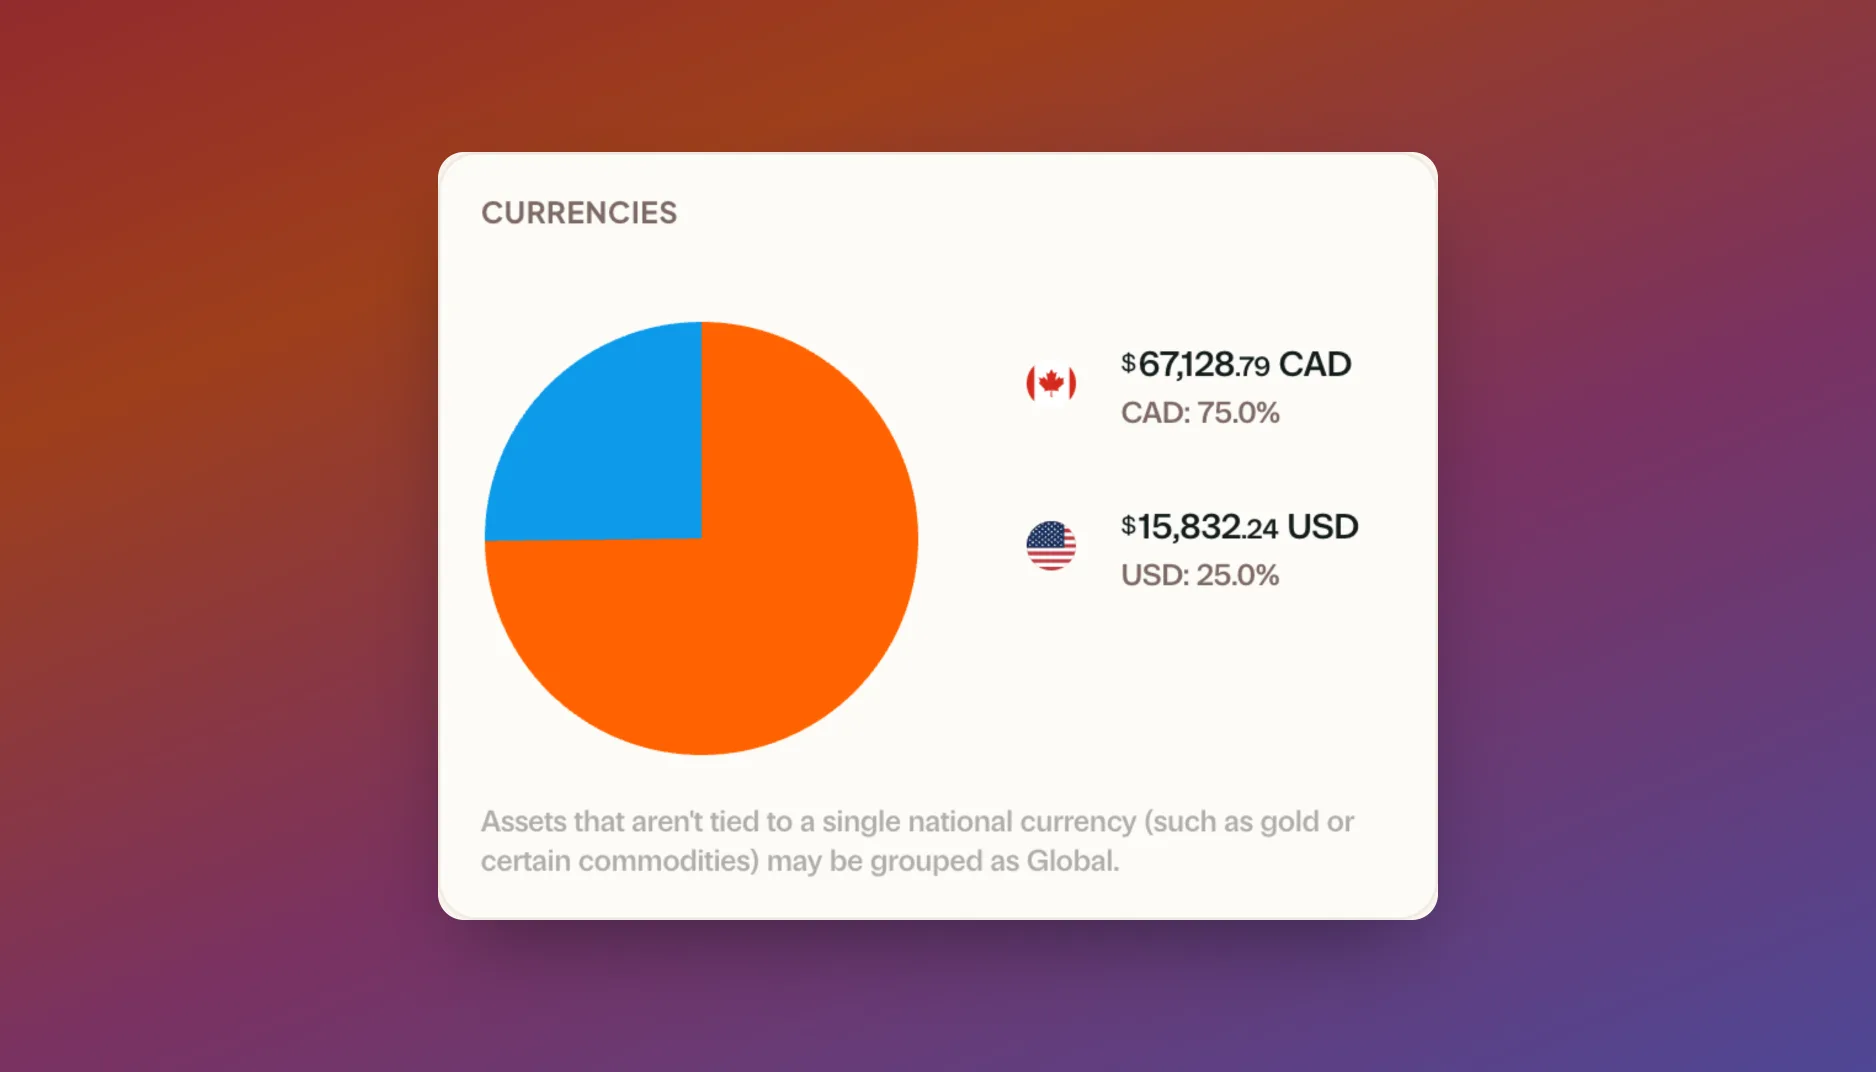
Currencies
CAD and USD, side by side.
Sectors
Where your money actually works.
Regions
Canada, the US, and everywhere else.
Currencies
CAD and USD, side by side.
And what it costs you
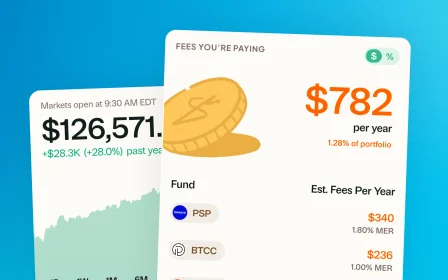
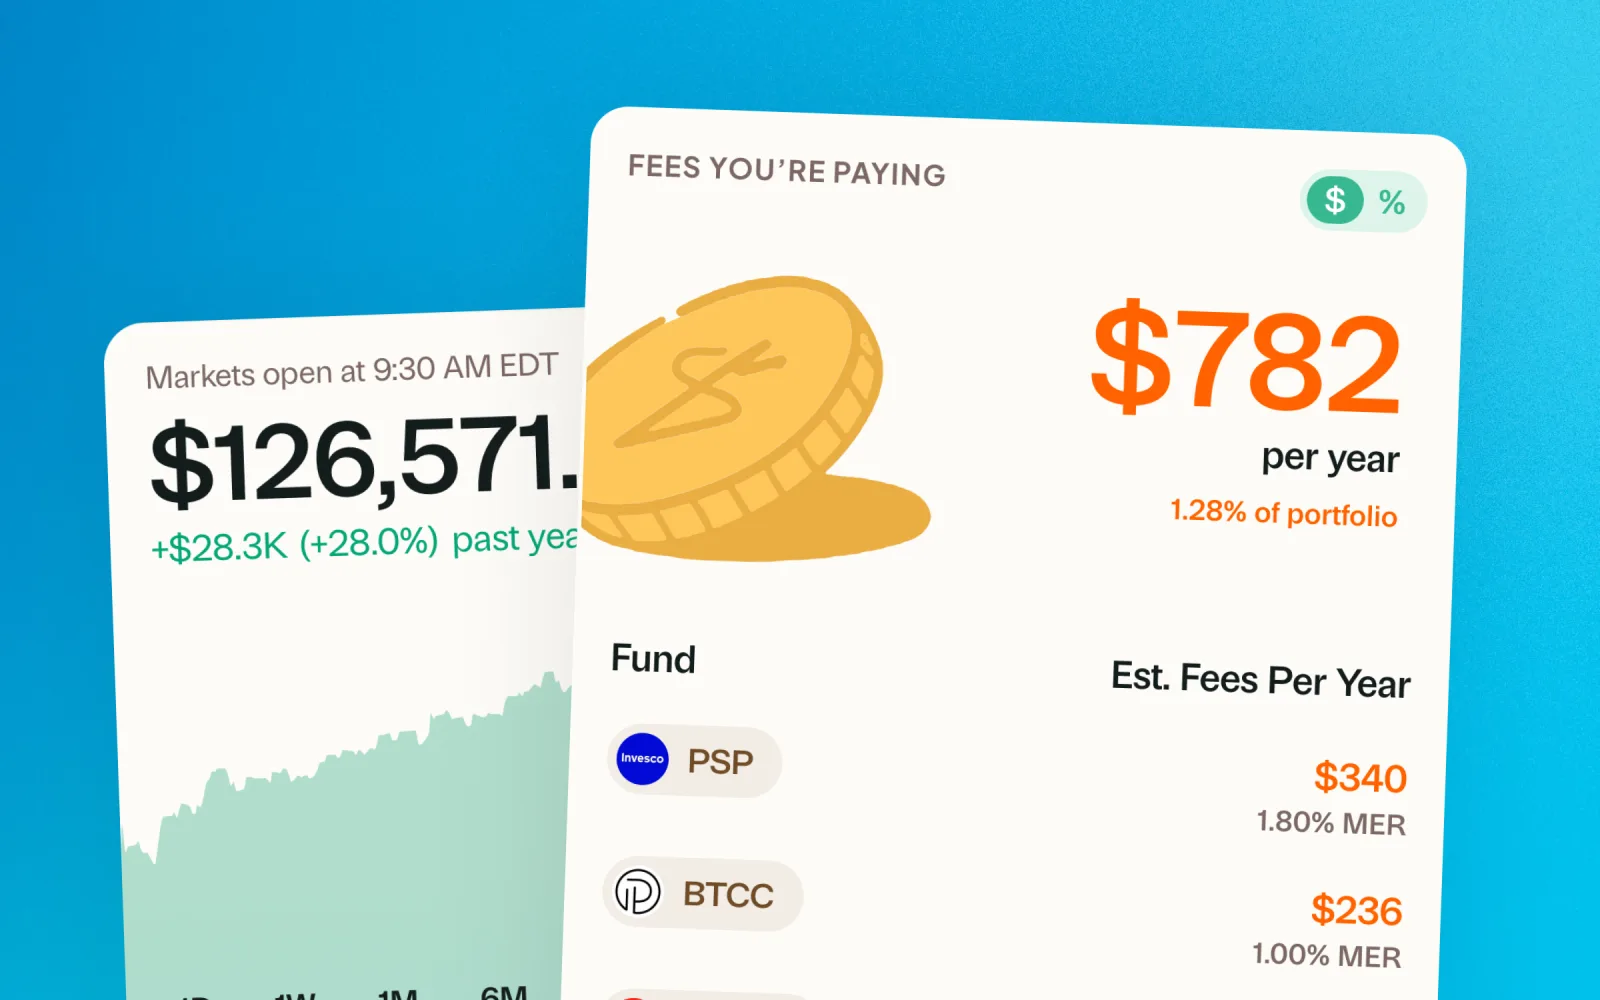
Every fund you own charges a fee. Greenline shows it in dollars, per holding, so the number finally feels like money.
See how fees affect your returns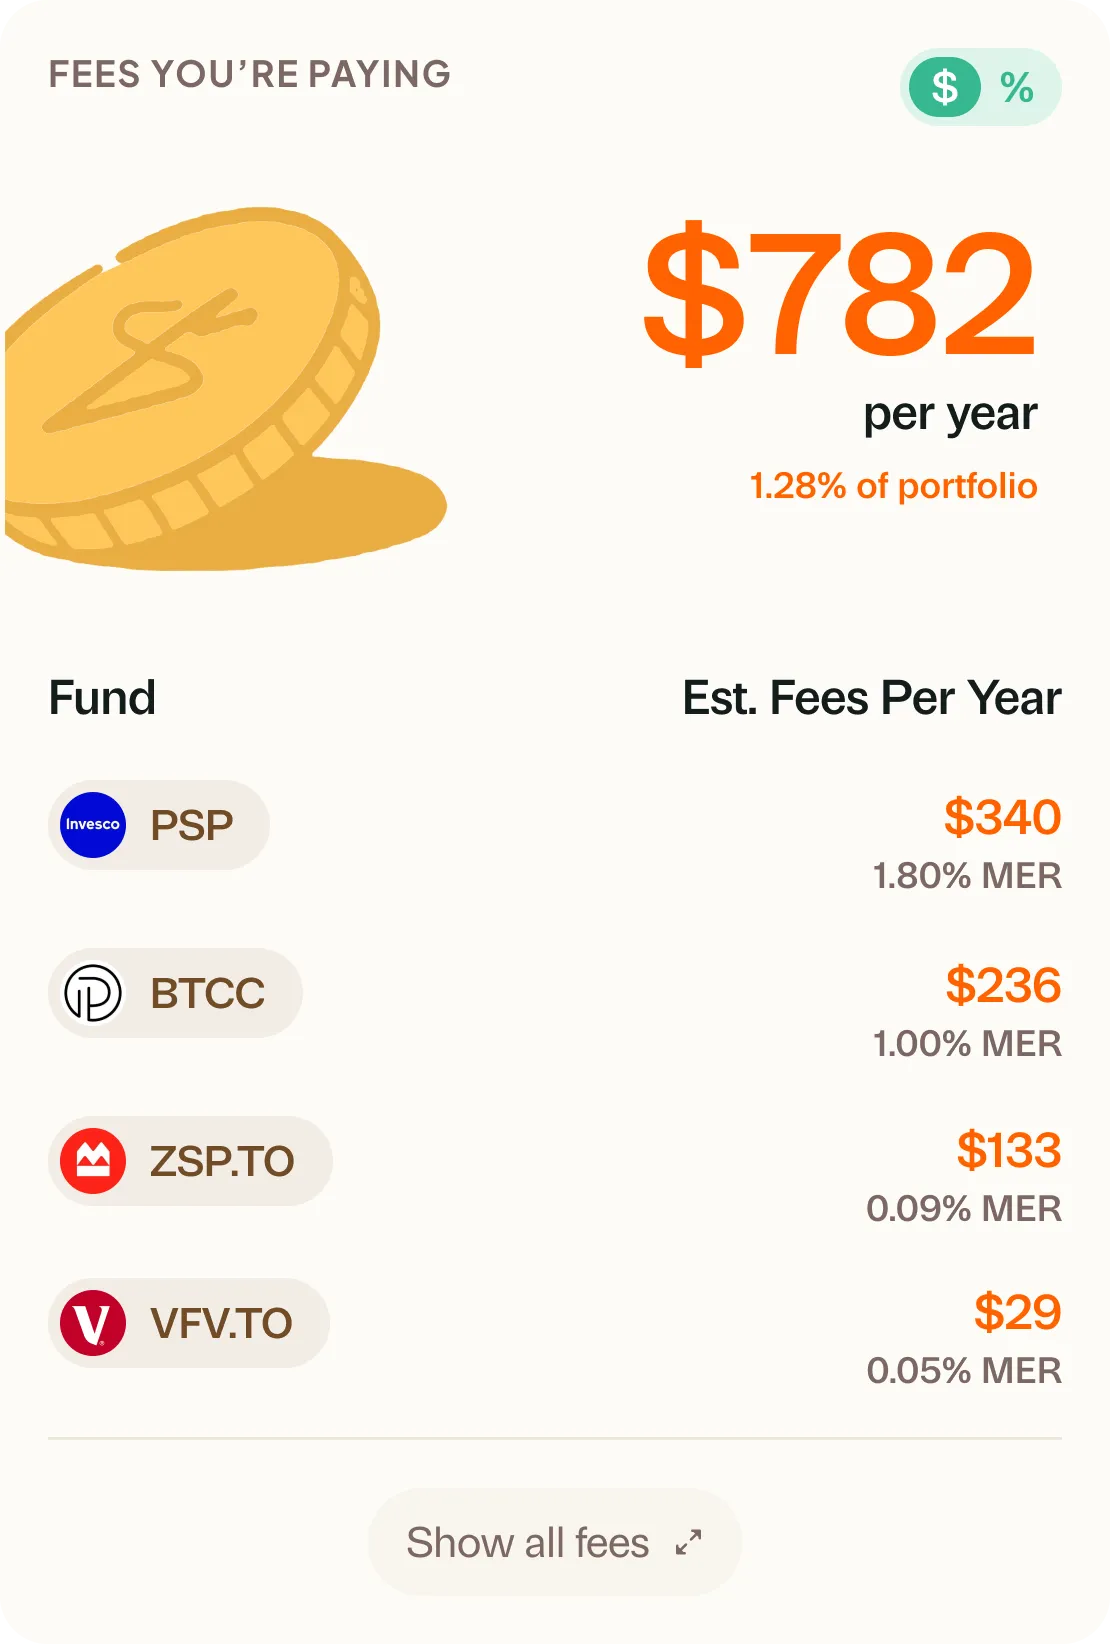
Questions, answered
Does ETF look-through work for Canadian ETFs?
Yes. Greenline looks inside the funds you hold, including all-in-one Canadian ETFs, and blends their contents into your real sector, region, and currency exposure.
Can I see a single holding across several accounts?
Yes. A holding you own in more than one account shows up as one position with a per-account breakdown, so you see both the whole and the parts.
How are purchase lots tracked?
Every buy is kept as its own lot with its own cost and date. The holding page shows how each lot has performed since you bought it.
Are fees shown in percentages or dollars?
Both, but dollars lead. A 0.65% MER means little until you see what it costs you per year on your actual balance.
Where to look next
Track all your accounts
Every account in one portfolio, no bank linking.
Analyze your portfolio
See every holding up close, and what your ETFs really hold.
See your track record
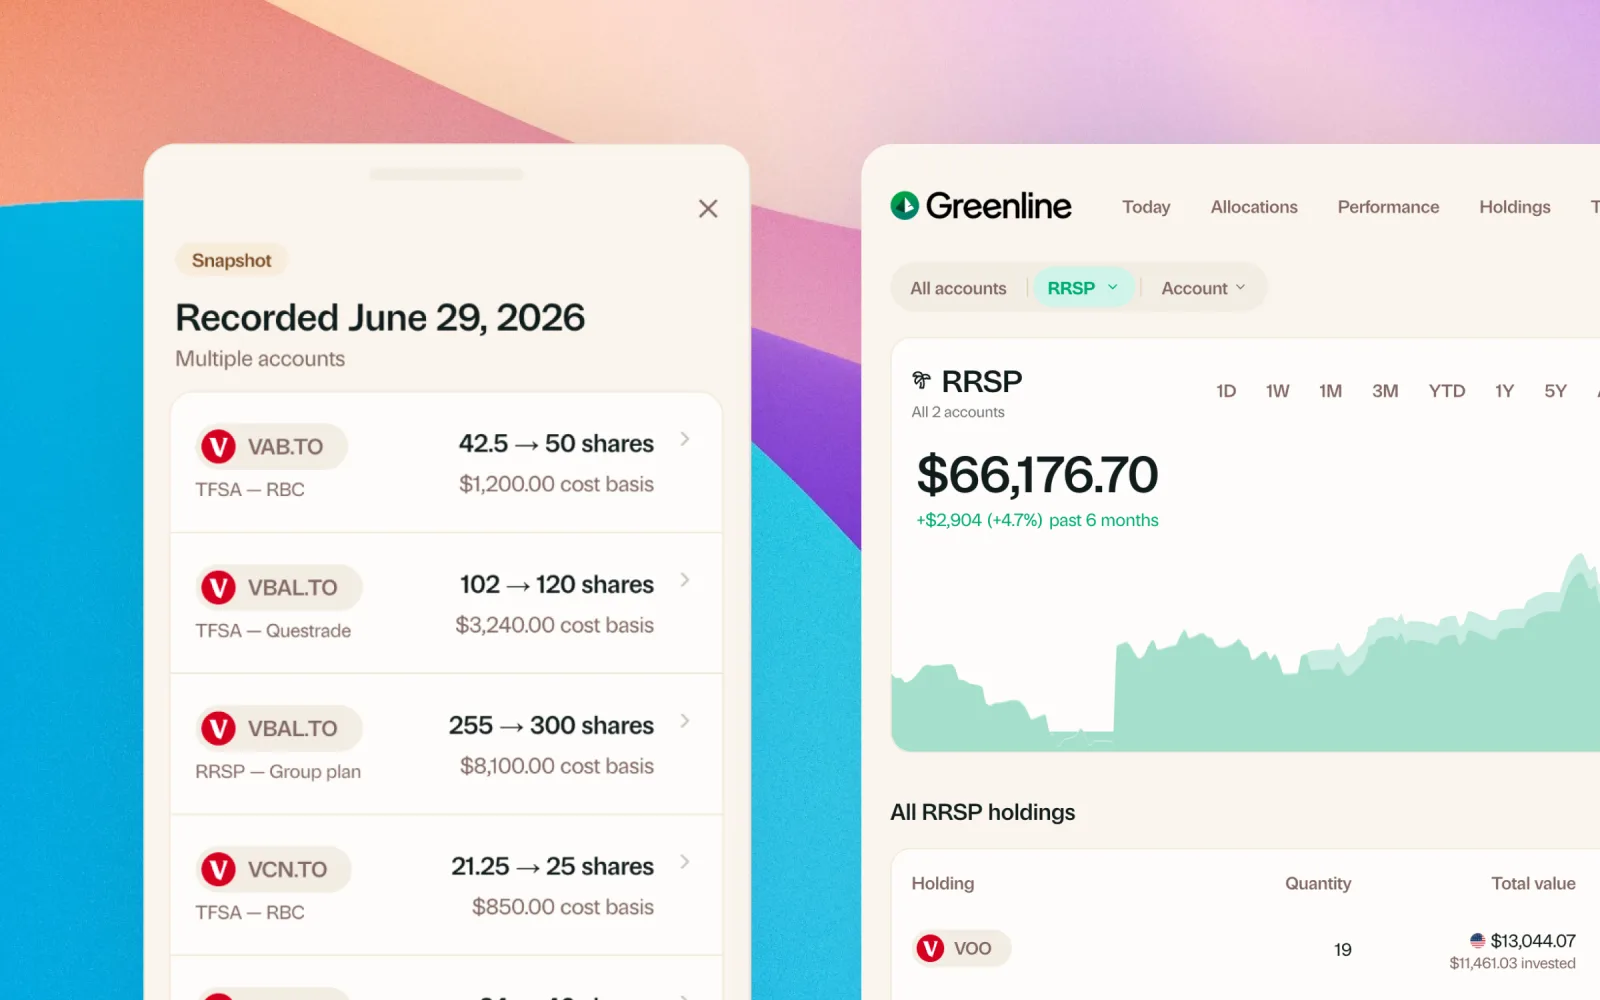
Your value over time, your records, and year by year.
Continue the story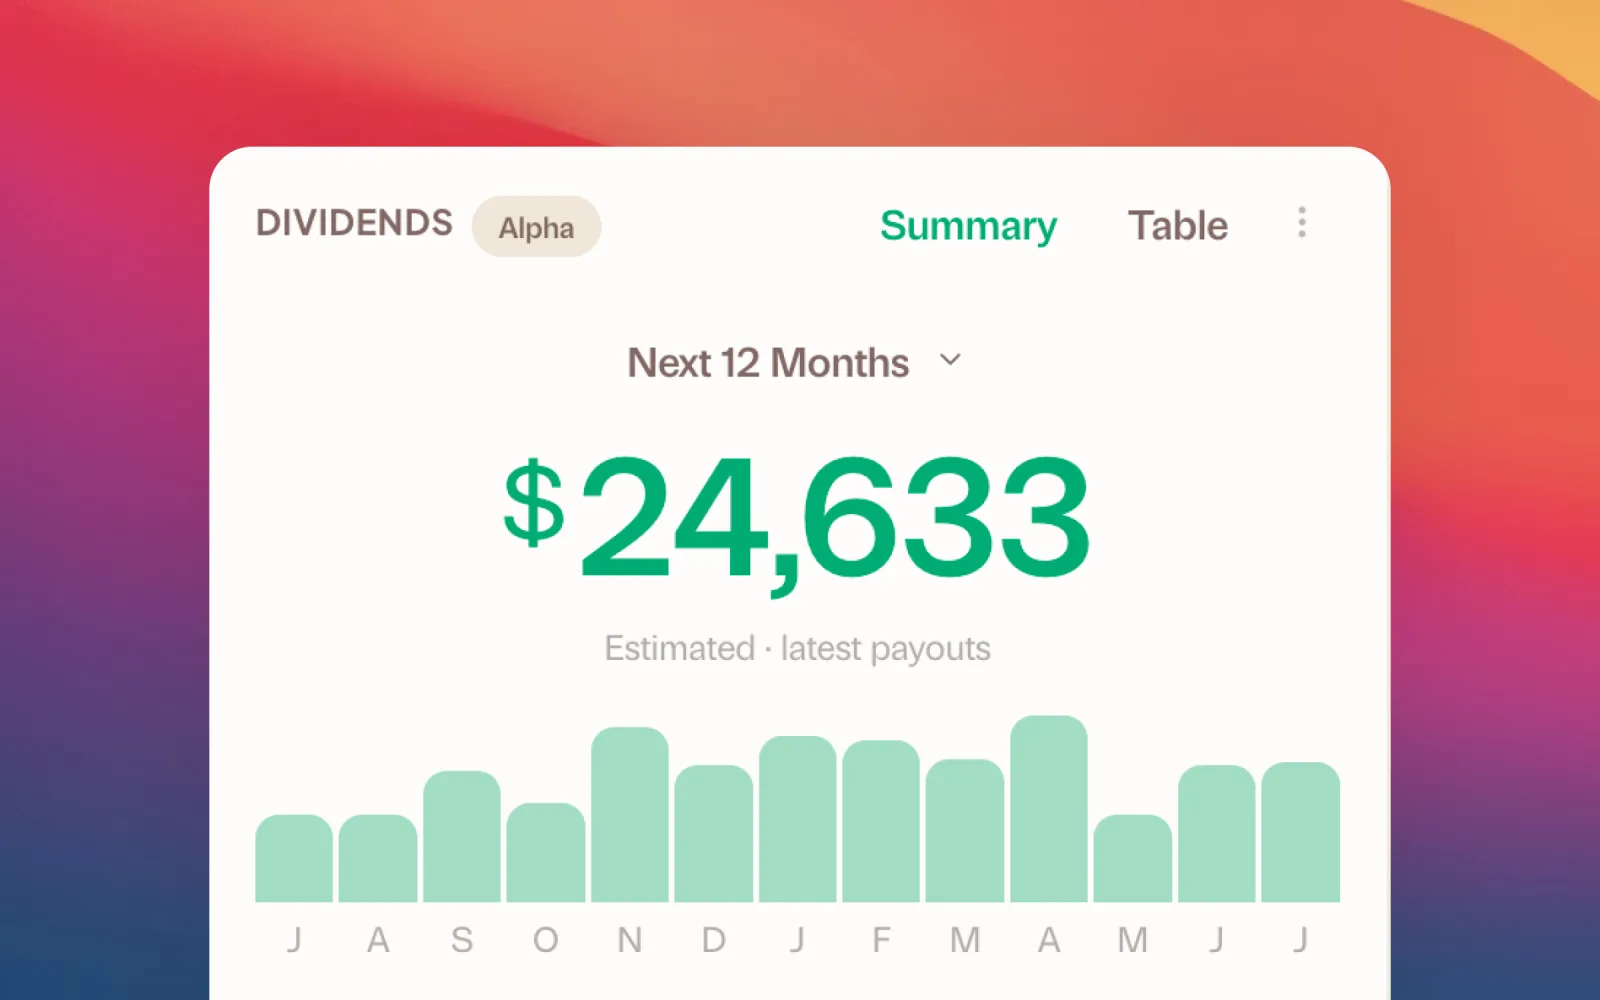
Track your dividends
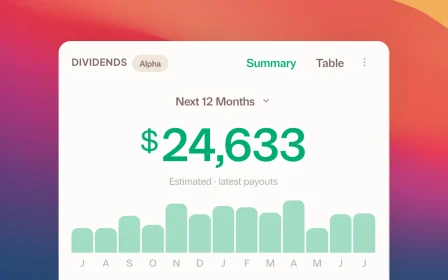
Estimated payouts ahead, a clean record behind.
Understand your capital gains
ACB and gains, tracked as you go.
Track all your accounts
Every account in one portfolio, no bank linking.
Analyze your portfolio
See every holding up close, and what your ETFs really hold.
See your track record
Your value over time, your records, and year by year.
Continue the storyTrack your dividends
Estimated payouts ahead, a clean record behind.
Understand your capital gains
ACB and gains, tracked as you go.
Ready to know exactly what you own?
See your full portfolio, freeFree during Beta. Early Members will be offered better rates than new users when we launch paid plans.