
December 22, 2025 · New feature
Preview your capital gains anytime
A new Estimated Capital Gains chart so you can keep an eye on gains and losses throughout the year, not just at tax time.
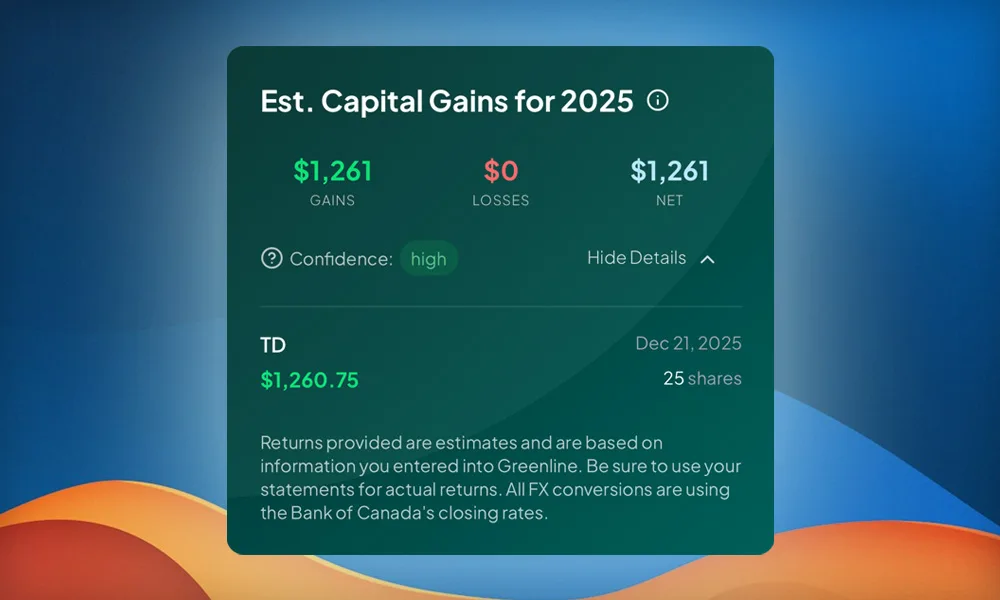
As we close out 2025, Greenline is adding a new way to keep an eye on your capital gains throughout the year.
The new Estimated Capital Gains chart provides a simple, high-level snapshot of your accumulated capital gains or losses for the current tax year, based on the information you have entered.
A few things to know
This applies only to holdings in non-registered accounts. Transactions in registered accounts (TFSAs, RRSPs, FHSAs, and RESPs) are excluded.
If you have updated your data using Greenline’s Snapshots tools (PDF statements or screenshots), some proceeds may not yet be captured in your estimates. Entering your full transaction history via direct entry or CSVs generally provides the most complete data.
To be clear: we are not here to replace your accountant, and these calculations should not be relied upon to do your taxes. We built this so you can always get a rough pulse check on your capital gains, not just around tax time.
Where to find it
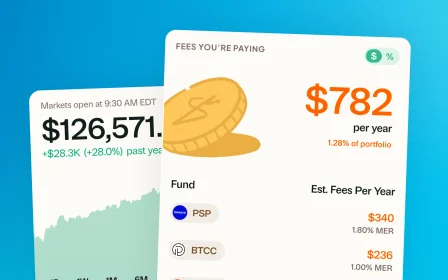
You can find your Estimated Capital Gains near the bottom of your Dashboard, just below your Fees chart. If there is nothing detected to report, it returns $0.
Let us know what you think.
More updates
September 10, 2026
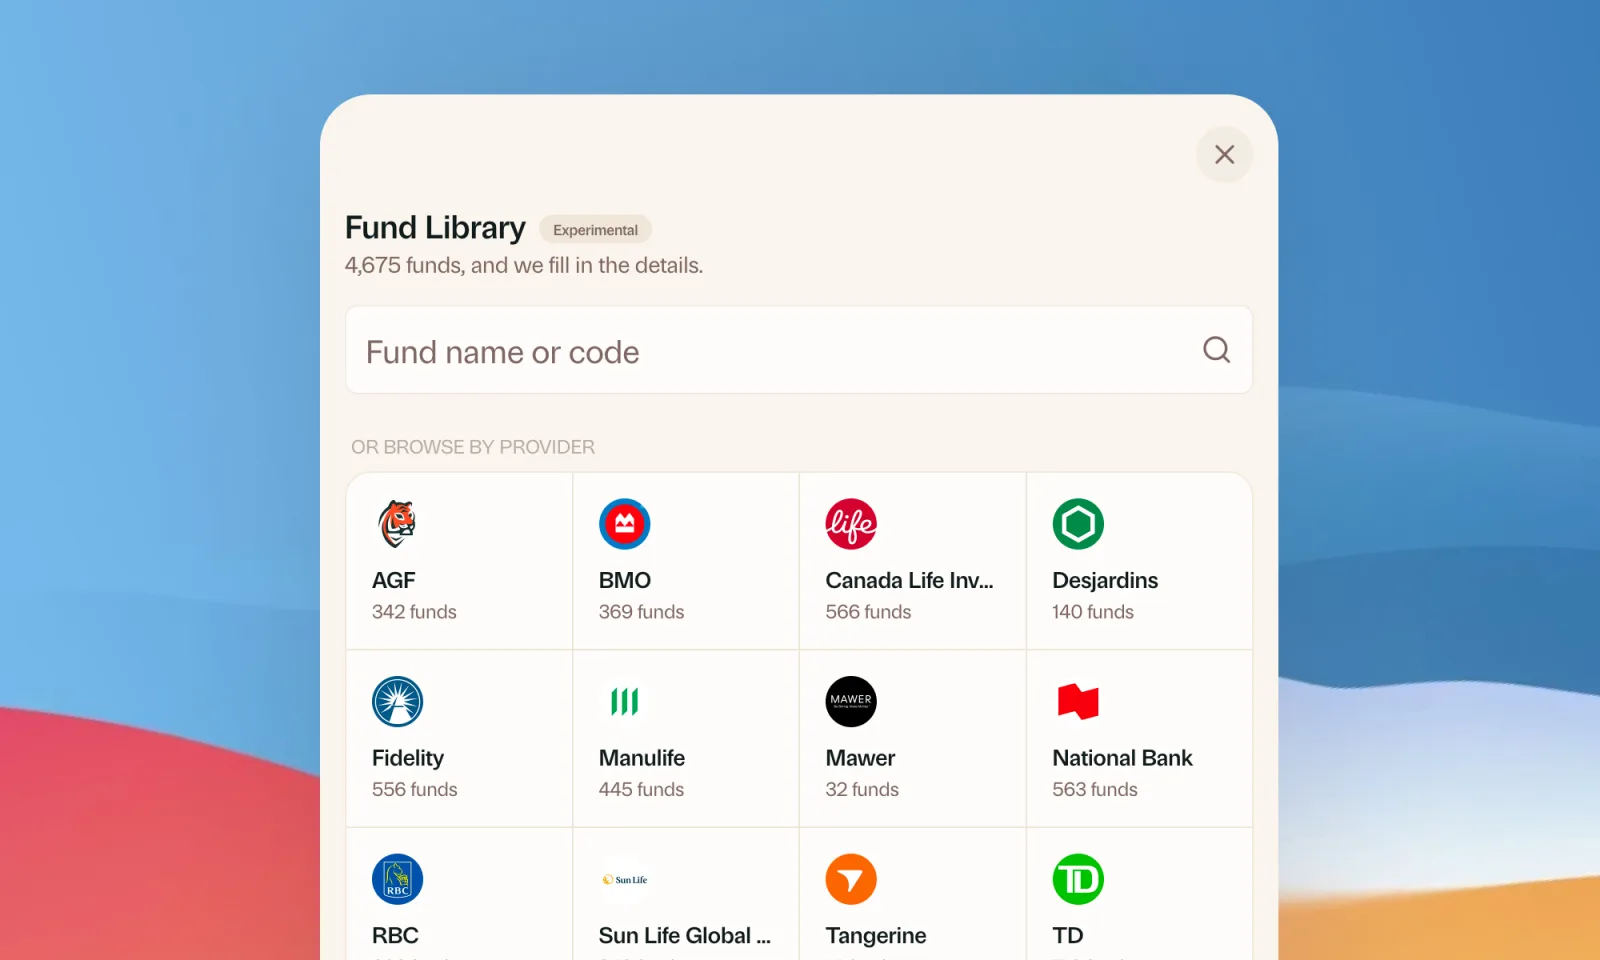
Find your mutual funds in the Fund Library
Search more than 4,500 Canadian mutual funds and get sector and region allocations, fees, and holdings filled in for you.
September 1, 2026
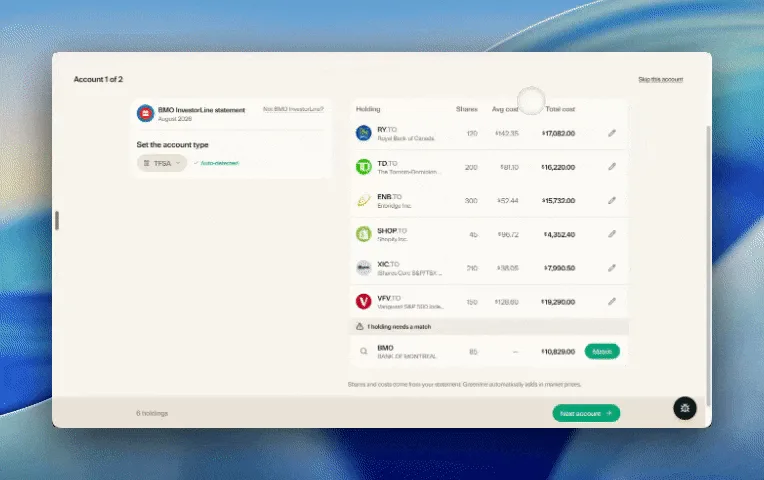
Easier imports, short tours, and sign in with any email
Fix an import yourself, update every account from one place, get a quick walkthrough when you're stuck, and sign in with any email address.

August 21, 2026
Greenline in The Globe and Mail
Andrew Galbraith at The Globe and Mail tried Greenline and wrote about it. We're honoured.
August 6, 2026
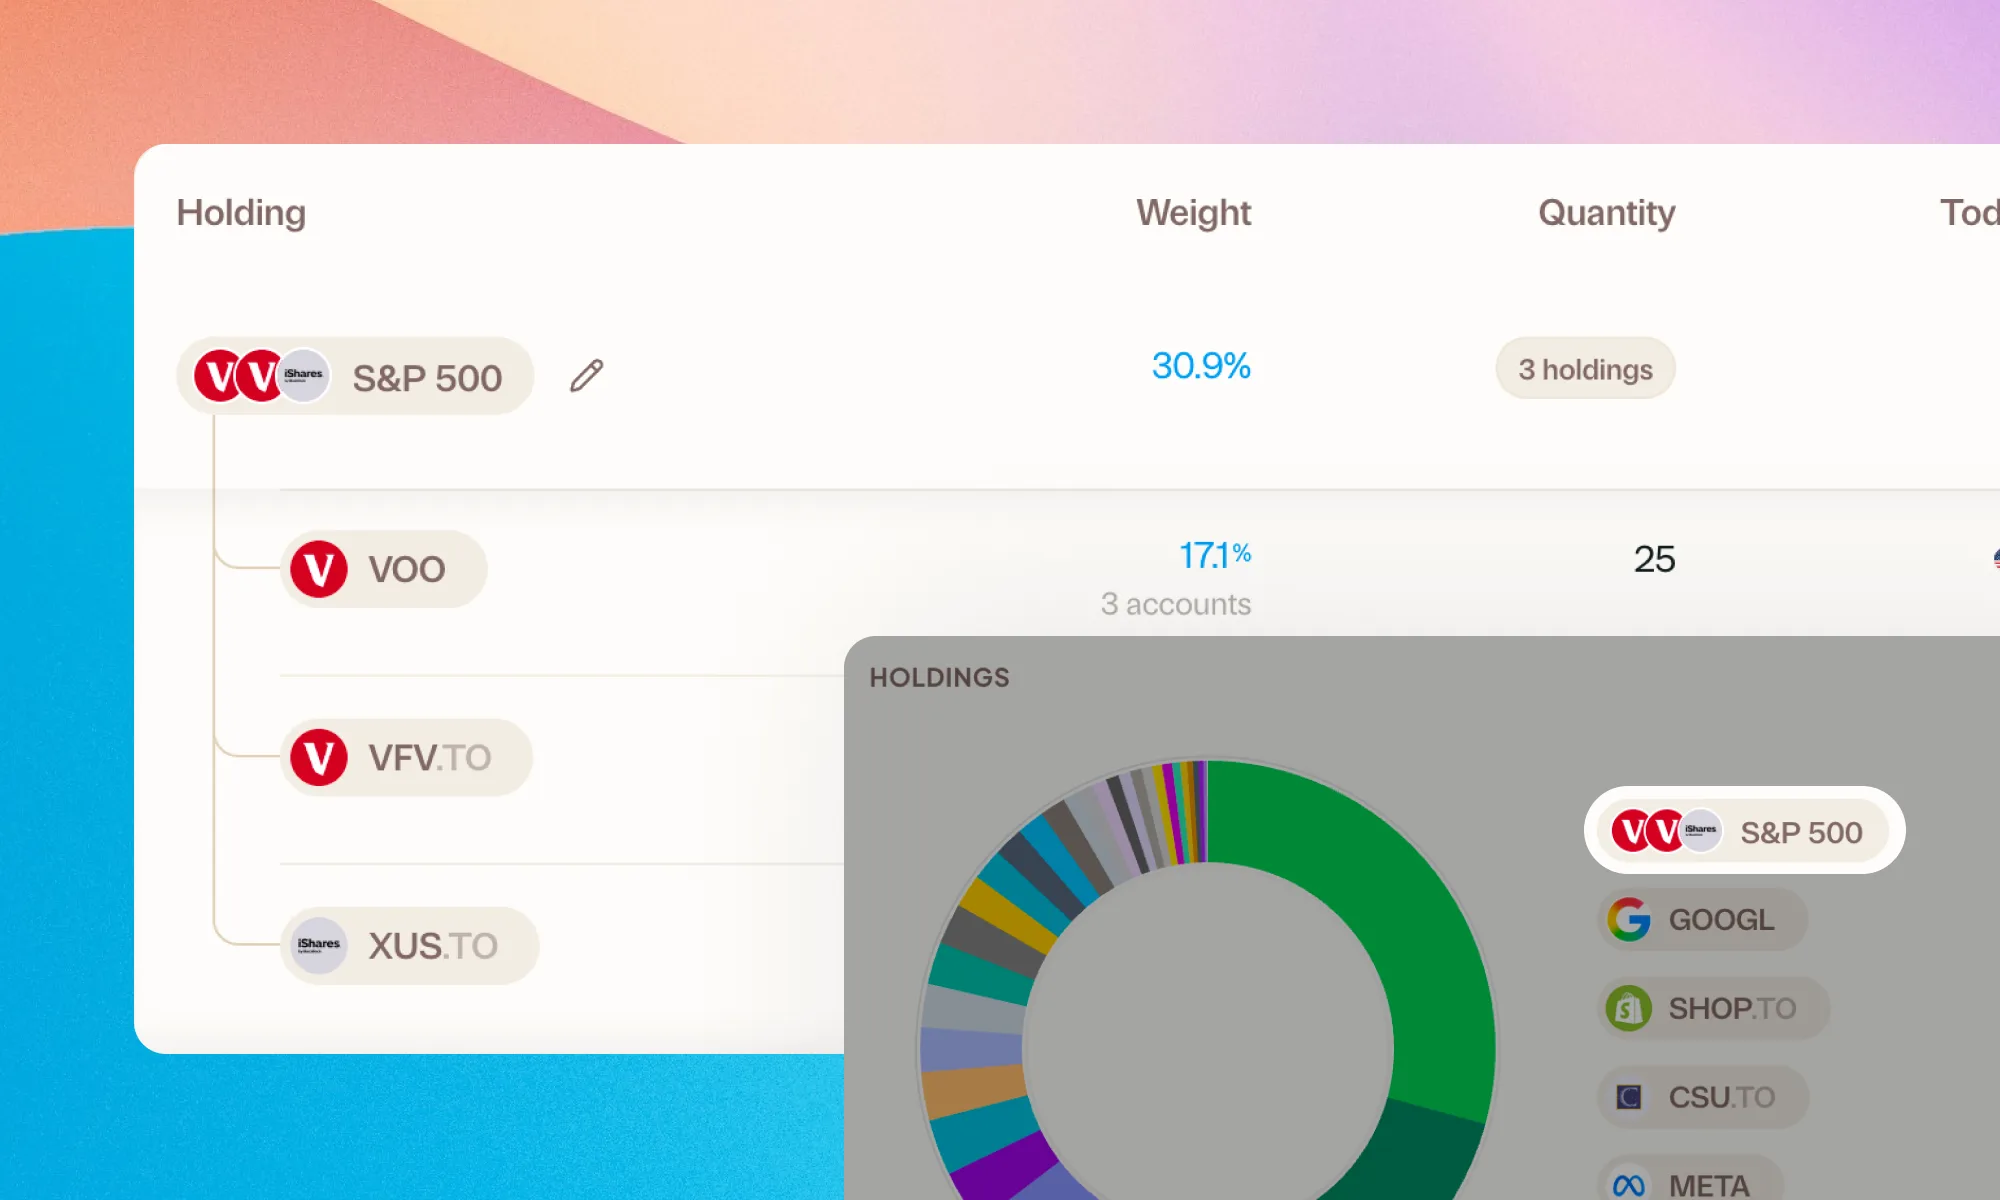
Group your holdings, however you'd like
Bundle VFV, VOO, and XUS into one S&P 500 row. Or build a Big Five banks group. Your portfolio, your groupings.